Keep the kidney function equation beside an eGFR trend
By Mr.Apps · Oct 26, 2026
Category:Energy

Estimated glomerular filtration rate, or eGFR, is a calculated estimate of how well the kidneys filter waste from the blood. It is not a direct measurement. The laboratory uses a blood marker and an equation to produce the estimate. If the equation changes, the reported eGFR can change even when the underlying biology has not changed by the same amount. That is why an eGFR trend should keep the equation, units, laboratory, and date beside each value.
This distinction matters when comparing older and newer results. A chart that shows only a line can imply that every point was produced in the same way. If a laboratory adopts a different estimating equation, the line may include a methodological shift as well as any biological change. The result still matters, but it needs its calculation context. I treat eGFR as a useful estimate whose interpretation depends on how it was produced and what other kidney measures show.
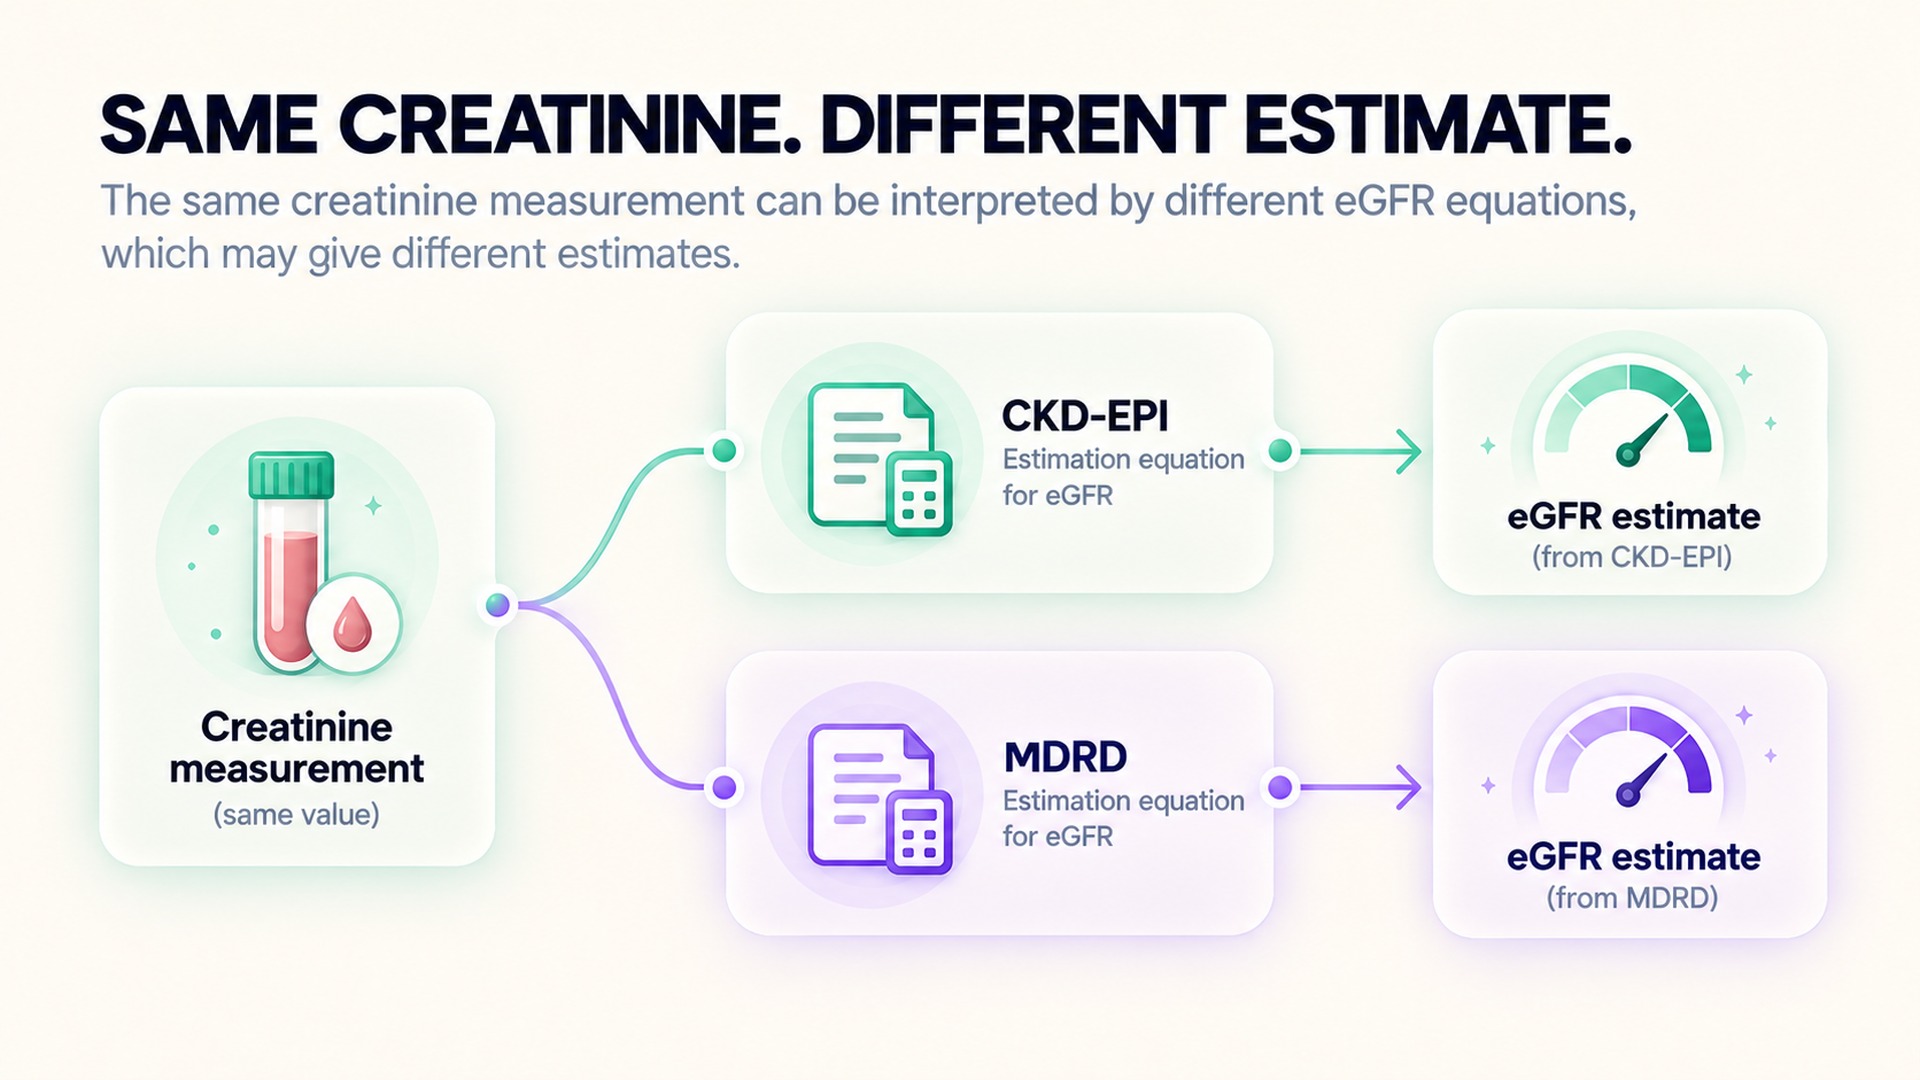
What eGFR represents
The kidneys filter blood through many small structures. Clinicians use GFR as an overall index of filtration, but measuring it directly is complex. In routine care, a blood test such as creatinine is often used with other information in an equation that estimates GFR. The guidance on the clinical equations used to estimate kidney function from laboratory blood measurements explains that eGFR is an estimate and that different equations can produce different reported results.
Creatinine is a waste product related to normal muscle metabolism. Its level in blood is affected by kidney filtering, but also by factors such as muscle mass, diet, and some medicines. The creatinine test overview explains what is measured and why creatinine alone is not the same as a direct GFR measurement. Equations use this marker to estimate filtration; they do not turn it into a measured value.
Some equations use creatinine alone, while others combine creatinine with cystatin C, another blood marker. The equation may also incorporate demographic variables. The exact formula affects how the result is calculated. The combined creatinine-cystatin equation reference shows how a particular equation uses standardized inputs. A patient-facing trend does not need to display the full mathematics, but it should make the method visible so the estimate is not mistaken for a direct measurement.
Why a new equation can shift the number
An equation is a model built to estimate GFR from measured inputs. Different models can use different variables, coefficients, or assumptions. Laboratories may update their reporting practice when professional recommendations change, a new equation is adopted, or the underlying assay calibration changes. When that happens, the same person can receive a different eGFR estimate without an equivalent change in kidney function.
The explanation of estimated kidney function notes that clinicians use equations because directly measuring GFR is difficult. The estimates help with assessment, but each has limits. A difference between two values might reflect biological change, an equation change, assay variation, or more than one factor. The report and clinical context help sort those possibilities.
A change in the blood marker can also affect the estimate. Creatinine is influenced by muscle production and other factors, while cystatin C has its own sources of variation. A result calculated with one marker may not match an estimate that combines two markers, even when both are intended to describe filtration. That is why the marker and equation belong beside the eGFR value rather than hidden in a technical footnote.
When clinicians review a possible change, they may ask whether the equation changed at the same time, whether the blood sample was processed in the same way, and whether other tests moved in a similar direction. A urine albumin result, for example, answers a different question from eGFR and can add information to a kidney assessment. The values should remain separate in a record so that a change in one does not get mistaken for a complete summary of kidney function.
A trend should therefore be divided into comparable periods when the method changes. Do not draw one smooth line across a formula change without marking it. If the laboratory supplies a note about a new equation or a revised result, keep that note with the original test. Ask the clinician whether the values can be compared directly, whether the prior result should be recalculated if possible, and whether another marker is useful for the specific question.
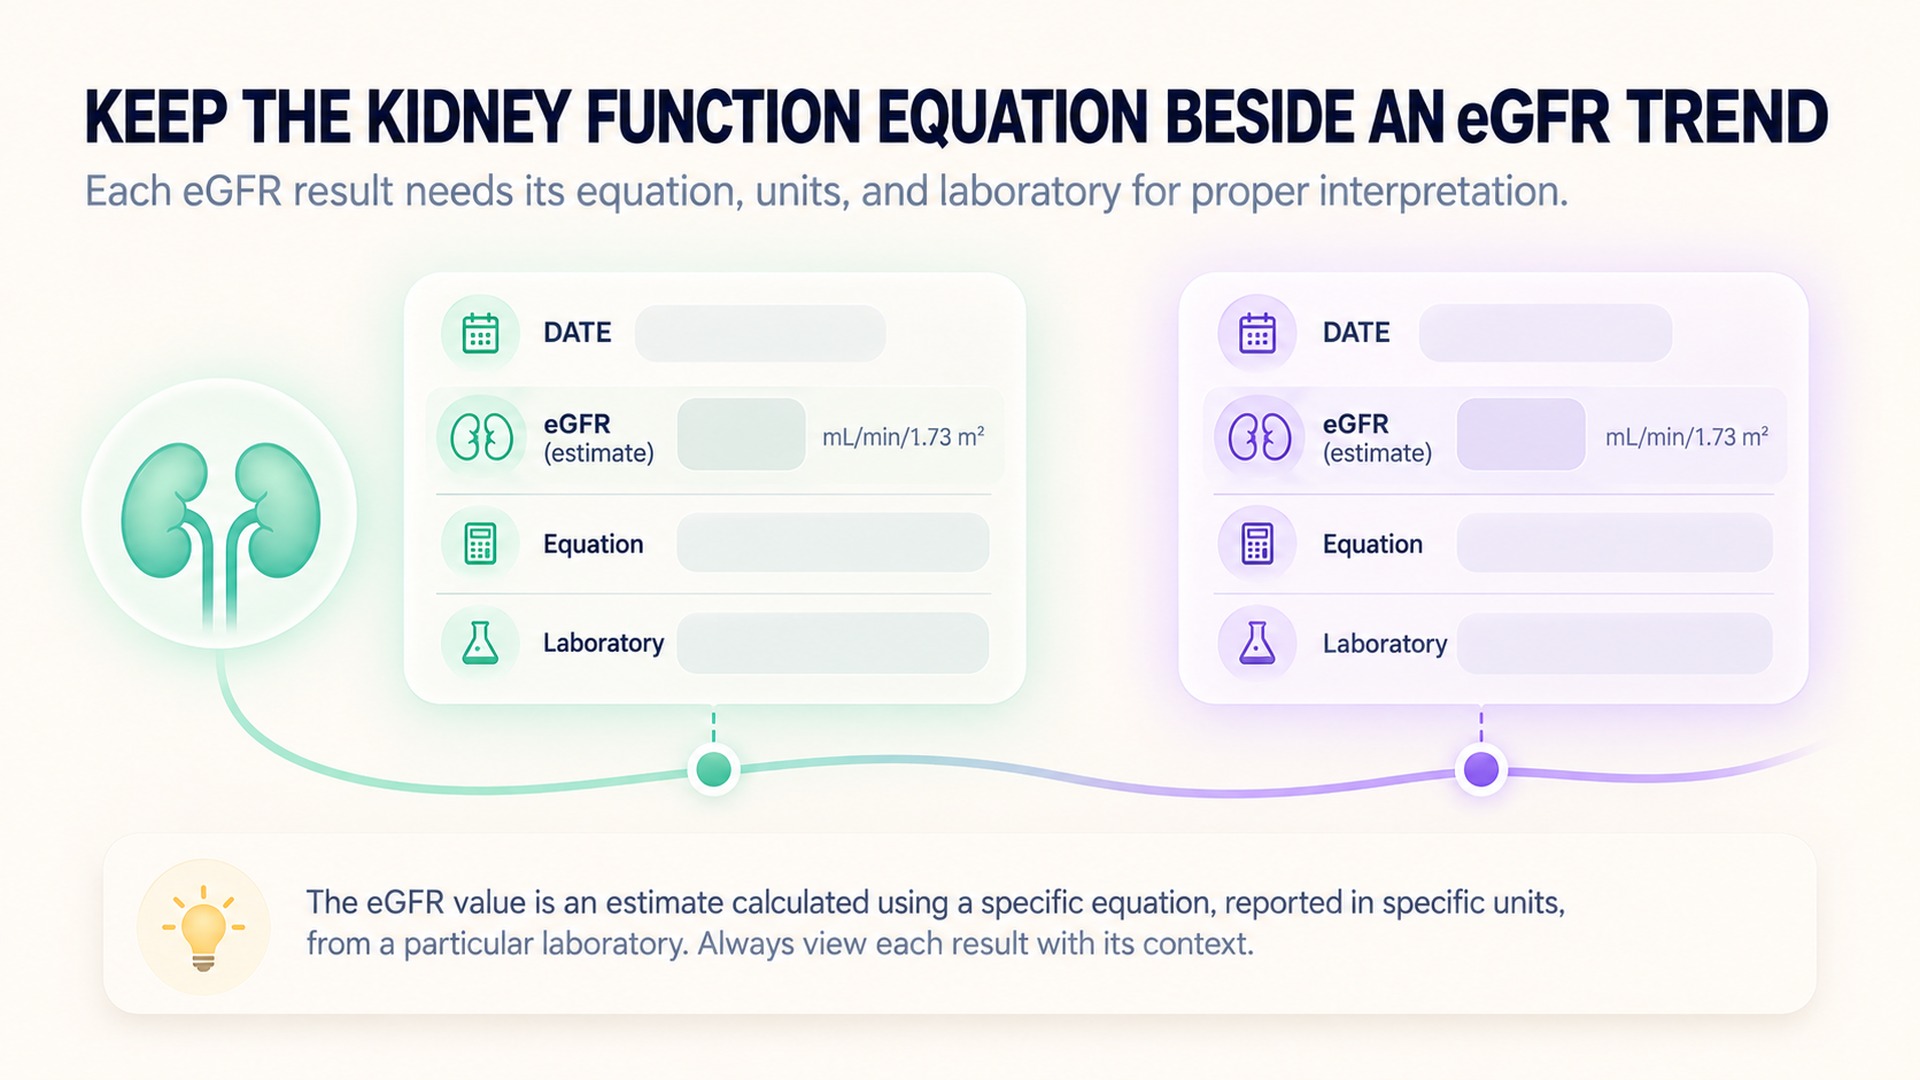
Preserve the calculation context
For each result, keep the collection date, eGFR value, units, serum marker used, laboratory name, and equation if reported. eGFR is commonly expressed relative to a standardized body surface area; keep the unit as shown rather than converting or omitting it. If the result came from a different lab, record that as well. These details help explain why two values may not sit on a perfectly continuous trend.
If a laboratory changes its reporting equation, mark the transition date on the timeline. The earlier and later values can still be useful, but they may need separate interpretation. A chart could show a vertical note or method label at the point where reporting changed rather than implying that the line is fully comparable. If the lab can retrospectively calculate an old result using the new method, the clinician can decide whether that comparison is helpful and available.
The same rule applies to exported data from an app or health record. Keep the original eGFR value and its source details even if a display rounds the number or converts it into a category. Categories can summarize a result, but they can hide a formula change or a small shift in units. A note that says “equation changed” is more useful than silently smoothing the values into a single trend. Do not use a general chart to decide whether a diagnosis has changed; ask the clinician how the reported values fit the current assessment.
A useful record distinguishes a changed number from a changed method. If the equation name is missing, ask the laboratory or clinician which calculation produced the result. Do not infer it from the number alone. The guide to understanding laboratory results emphasizes that test names, units, reference intervals, and laboratory methods matter when results are reviewed.
Creatinine itself can change for reasons that do not represent a lasting change in kidney filtration. Recent illness, changes in hydration, muscle activity, and medicines may be relevant, depending on the situation. A clinician can decide whether to repeat testing, add urine albumin information, consider cystatin C, or look at another part of the medical record. Do not adjust a medicine or fluid intake based on an eGFR chart without professional guidance.
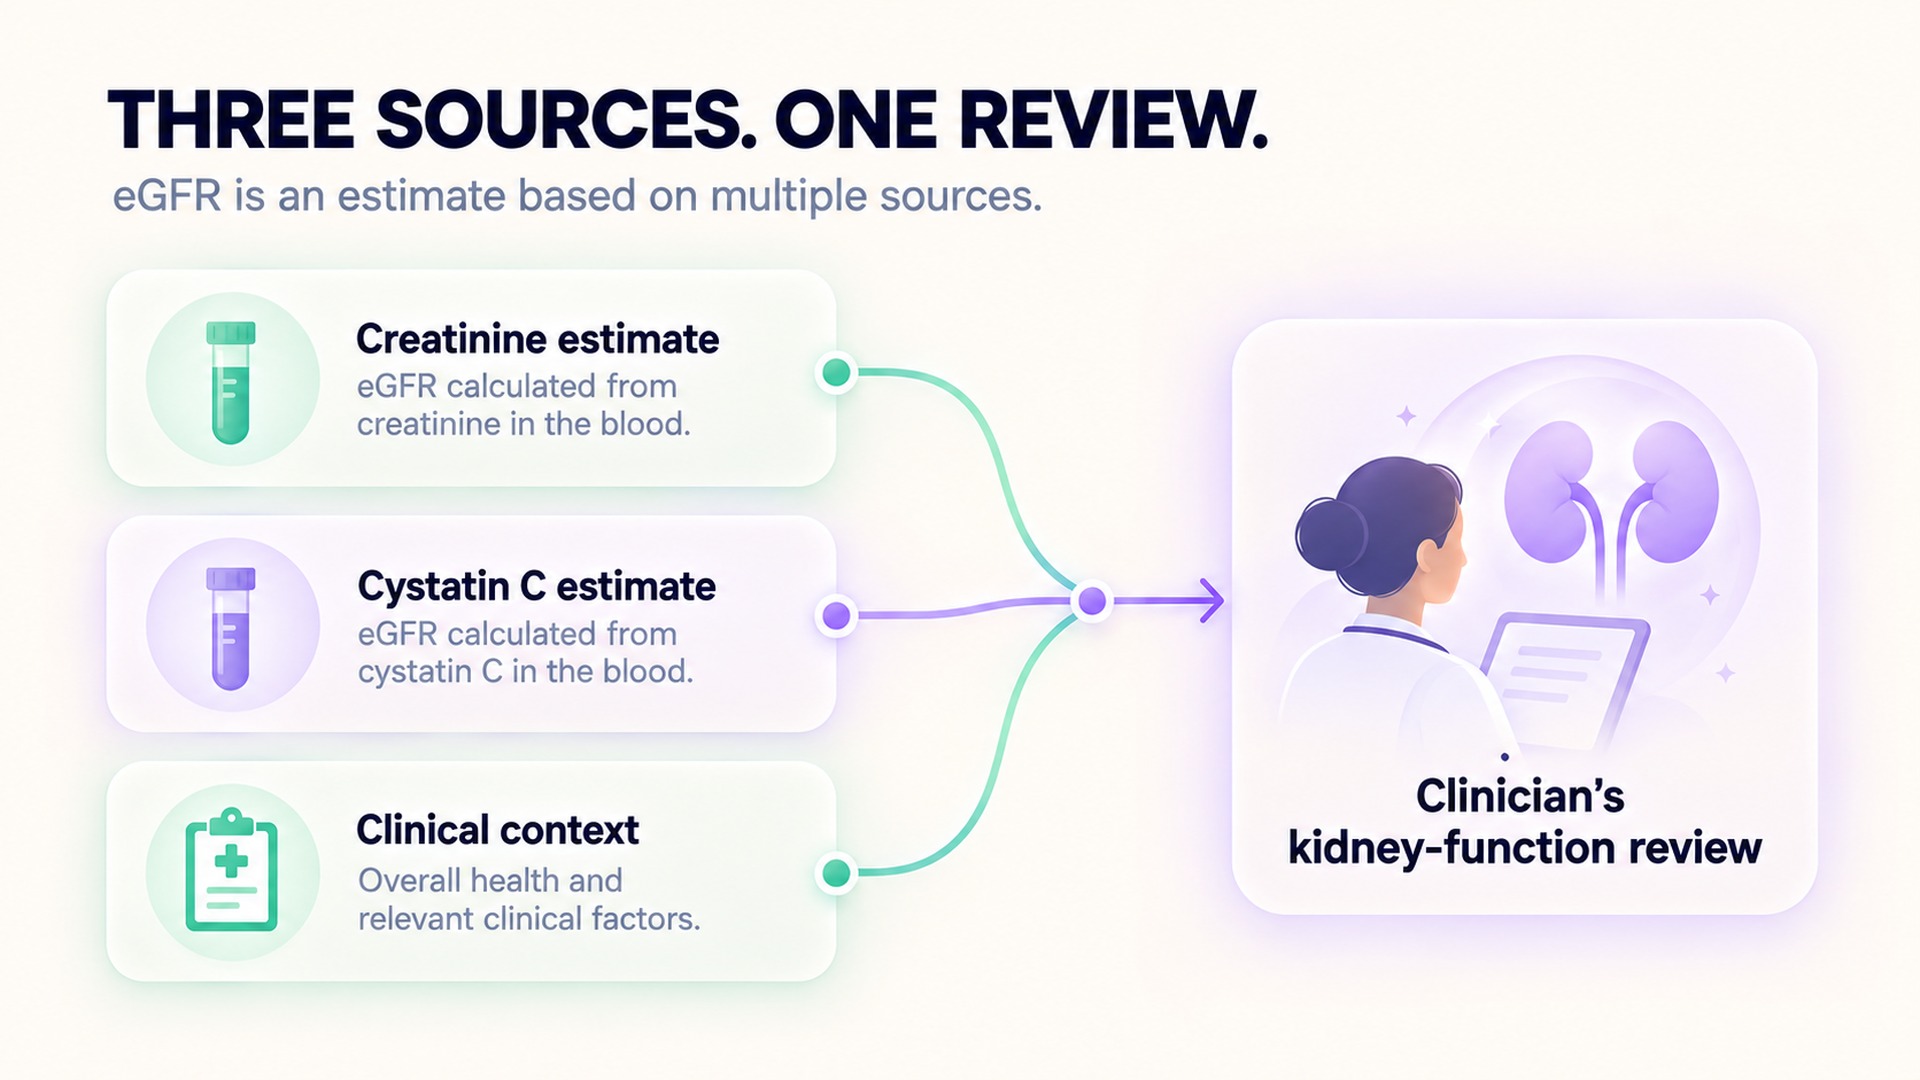
Read the estimate with other kidney information
A value should not be interpreted by comparing it with an online chart that does not specify the equation or units. Reference categories can provide orientation, but they do not replace the clinician's review of persistence, urine findings, and other risk factors. If a report uses an unfamiliar unit or the calculation method is not stated, ask the ordering team to clarify it before deciding that a trend has changed.
A useful summary can be short: list the result and date, identify the equation if known, mark any laboratory or method change, and include other relevant kidney tests. That preserves enough information to revisit the comparison later. It supports careful follow-up over time. It also helps separate what the lab measured from what the equation estimated, which is the central distinction when following eGFR over time.
An eGFR value is not a complete description of kidney health. The reason it was measured, whether the value persists, urine findings, symptoms, blood pressure, medicines, and other clinical factors may all matter. A single low estimate does not necessarily establish chronic kidney disease, just as a value within a broad reference range does not answer every clinical question. The eGFR calculator and interpretation resource describes eGFR as an estimate to be interpreted with other information.
For a broader explanation of why health measurements should keep their method and context attached, see this overview of interpreting health biomarkers. In practice, an eGFR trend is most useful when each point carries its equation and units, and when a clinician considers it with the rest of the kidney assessment. That helps distinguish a calculation change from a possible change in health.
Questions people ask
Can eGFR change when kidney function has not changed?
Yes. A laboratory may use a different equation or method, and that can shift the estimate. The result is still important, but the equation and other clinical information should be reviewed before comparing it with an earlier value.
Is eGFR the same as a direct measurement of GFR?
No. eGFR is calculated from blood markers and an equation. A direct GFR measurement is different and is not used for every routine assessment.
What information should stay with an eGFR result?
Keep the date, units, laboratory, equation or method if reported, and the marker used. Preserve the original report and ask the clinician whether values from different methods can be compared directly.
*This article is for informational purposes only and is not a substitute for professional medical advice, diagnosis or treatment.*
Sources:
National Institute of Diabetes and Digestive and Kidney Diseases·National Library of Medicine·National Kidney Foundation·National Kidney Foundation·National Library of Medicine·National Kidney Foundation
Related articles

Creatine kinase after exercise requires symptoms and timing
Learn why recent exercise, test timing, and symptoms all matter when a creatine kinase result is reviewed. See why CK is a clinical marker rather than a training target and when unusual symptoms need prompt attention.

Normal oxygen saturation does not establish a normal hemoglobin level
A pulse-oximeter percentage estimates how much available hemoglobin is carrying oxygen, while a blood count measures hemoglobin amount. Learn why one reassuring reading cannot replace the other test or a clinical review.

A raised CRP result cannot identify the source of inflammation
A raised CRP can signal inflammation, but it cannot identify where the process is or what caused it. Learn why standard CRP and high-sensitivity CRP serve different purposes and need clinical context.

When a vitamin B12 result needs a methylmalonic acid check
Learn why a clinician may consider methylmalonic acid when a vitamin B12 result leaves a question unresolved. See how kidney function, symptoms, medicines, and other tests shape interpretation.

Reading TSH and free T4 together in a fatigue review
Learn what TSH and free T4 contribute to a fatigue review and why the two results need clinical context. See how symptoms, medicines, timing, and prior results help keep a lab value in its proper role.

Why Metabolic Energy Efficiency and Daily Energy Are Different Concepts
Metabolic energy efficiency describes processes involved in handling fuel, while a daily energy score is usually a separate app estimate about patterns such as sleep, activity, and recovery. Similar wording does not mean the two measures track the same thing.

Why a Monthly Metabolic Trend Cannot Explain One Meal
A monthly metabolic trend summarizes signals across a longer window and cannot identify what one meal did to glucose or insulin. Read it as a broad estimate, keep meal notes in their proper context, and use clinical testing for medical questions.

How Charging Gaps Break a 24-Hour Energy Timeline
Removing a wearable to charge creates a period when the device may not record the signals used by an energy model. A 24-hour timeline should mark that gap instead of treating it as neutral or connecting the surrounding values as continuous measurement.

How to Compare Energy Drain Across Days With Different Starting Scores
The ending value alone can hide how much an energy score changed during the day. Compare the start, decline, timing and data coverage on the same scale before interpreting differences between days.

Why Missing Hours Need to Be Visible on an Energy Timeline
Connecting two known points across an unmeasured interval can invent a smooth story about the day. An energy timeline should mark missing hours clearly so estimates, observations and unknown periods remain distinct.