Why Apple Watch, Oura, WHOOP, and Garmin Give You Different HRV Scores
By Mr.Apps · Sep 4, 2026
Category:HRV

The first time I wore two devices overnight, I expected their HRV values to be close. They were not. One showed a number that looked reassuring; the other reported a much lower value and a cautious recovery message. Both devices had watched the same person sleep in the same room on the same night.
The disagreement did not mean that one device was broken. Apple Watch, Oura, WHOOP, and Garmin can differ because they do not necessarily measure at the same time, use the same sensor location, clean the signal in the same way, or calculate and summarize HRV with the same method. The numbers may share a label while representing different slices of physiology.
That is why I do not compare wearable HRV as if it were temperature from four identical thermometers. I compare trends within one consistent system.
HRV is not one universal number
Heart rate variability describes variation in the intervals between heartbeats. There are several ways to turn those intervals into a value. Two common time-domain metrics are SDNN, the standard deviation of normal-to-normal intervals, and RMSSD, which emphasizes short-term beat-to-beat changes.
A detailed review of HRV metrics and interpretation explains that different measures reflect different mathematical properties and physiological influences. They should not be treated as interchangeable simply because both are expressed in milliseconds.
Apple's HealthKit documentation identifies its heart-rate-variability quantity as SDNN. WHOOP describes its HRV approach using RMSSD and a measurement period during sleep. If one platform reports SDNN from occasional samples and another reports RMSSD from a chosen overnight window, a difference is expected.
I think of it as asking two photographers to document the same event. One takes a wide shot every few hours. The other takes a close-up during one carefully selected period. Both photographs can be real, but the resulting summaries will not match.

Measurement timing changes the answer
HRV moves throughout the day and night. Posture, breathing, movement, sleep stage, recent exercise, mental load, food, temperature, and illness can all influence it. A value captured while I am awake at a desk may differ from one captured during stable sleep.
Apple explains that its watch measures heart rate in the background at intervals that vary with activity and also records heart rate continuously during workouts. Its overview of heart-rate measurement makes clear that collection depends on the situation rather than following one fixed all-night protocol.
Oura states that it calculates nighttime HRV using five-minute samples and shows an overnight average and maximum. Its HRV guidance focuses on sleep because movement is lower and conditions are more consistent. WHOOP likewise emphasizes a selected period during sleep in its explanation of HRV and recovery.
Garmin uses overnight data to establish a personal range for its HRV status feature and interprets recent values against that baseline. This is a different product question from displaying isolated daytime samples.
When I place four daily values side by side, I may be comparing an overnight average, a sleep-window estimate, an opportunistic snapshot, and a baseline-based status. The labels look similar, but the sampling windows are not.

Sensor location and fit affect signal quality
Most consumer wearables estimate pulse timing through photoplethysmography, or PPG. LEDs and optical sensors detect changes in blood volume beneath the skin. A finger ring and a wrist watch observe different anatomy. Blood flow, movement, contact pressure, skin characteristics, ambient light, and temperature can influence the signal.
The wrist is convenient but moves frequently. The finger can provide a strong pulse signal but ring fit matters. A strap that is too loose may allow light leakage and motion artifacts. A ring that rotates or fits differently as fingers swell can also change data quality.
I have seen this in my own records. During a cold week, one device showed more gaps until I adjusted how I wore it. The numerical change was not proof that my nervous system had suddenly transformed. The data-quality graph offered a simpler explanation.
Each company also filters artifacts differently. Software must decide which beat intervals are plausible, which are caused by motion or poor contact, and whether a segment contains enough clean data to keep. Removing different intervals changes the final HRV estimate. Those filtering rules are often proprietary, so I cannot reconstruct every difference from the dashboard.
Published guidance on standardizing HRV measurement stresses the importance of recording conditions, artifact handling, duration, and analysis method. Consumer devices automate much of that process, but the underlying need for consistent conditions remains.
Daily summaries add another layer
Even if two devices began with identical clean beat intervals, they could summarize them differently. One might use an average, another a median, and another a weighted value from a selected part of the night. A platform may then compare the value with seven days, several weeks, or a longer personal baseline before assigning a readiness label.
Garmin's explanation of HRV status describes an overnight average and a seven-day average interpreted against a personal baseline. That status answers, “How does the recent pattern compare with your established range?” It is not the same question as, “What was one raw HRV sample at 3:00 p.m.?”

This distinction becomes especially important when a score is normalized. A readiness score of 70 is not an HRV of 70 milliseconds. It may combine HRV with sleep, resting heart rate, temperature, activity, and recent trends. Two readiness scores can differ even when the underlying HRV values are similar.
I therefore export the rawest available view before comparing. I check the metric name, unit, sampling period, and whether I am looking at a single value, overnight summary, or rolling average. Many apparent contradictions disappear at that stage.
How I compare devices without getting misled
When testing two wearables, I define the question first. If I want to know whether both capture the same long-term direction, I wear them consistently for several weeks and compare their standardized trends. I do not expect matching milliseconds.
For each device, I calculate how far a day sits above or below that device's own typical range. If both show a downward trend after several short nights, they may agree in the way that matters even if one says 38 ms and the other says 61 ms.
I also avoid switching platforms in the middle of an experiment. A new device needs time to learn a baseline, and the metric may not be equivalent. I mark the switch date and treat the new series as a separate chapter.
Consistency matters more than brand loyalty. I wear the device in the recommended position, keep the firmware current, and compare similar nights. I note travel, illness, late training, and major schedule changes. Those steps reduce noise without pretending the device is a clinical ECG.
When accuracy matters beyond wellness
For training and general wellness, a stable personal trend can be useful even if the absolute number differs from another platform. For a medical question, the standard is different. Consumer HRV should not be used to diagnose an arrhythmia, autonomic disorder, or other condition without appropriate clinical evaluation.
If I have palpitations, fainting, chest pain, unusual breathlessness, or another concerning symptom, I focus on the symptom and seek professional advice. I may bring the device records as context, but I do not ask the HRV score to determine the cause.
The disagreement among Apple Watch, Oura, WHOOP, and Garmin becomes less frustrating once I recognize that each device is running its own measurement and interpretation pipeline. Timing enters first. Sensor location and contact affect the pulse signal. Filtering removes different artifacts. The chosen HRV formula turns intervals into a value. The app then summarizes that value and compares it with a baseline.
At the end of that chain, four different numbers are not surprising. What matters is whether one consistent device, worn consistently, shows a pattern that matches the rest of my context.
I no longer ask which wearable owns the “real” daily HRV. I ask a more useful question: within this device's method, is my trend stable, changing, or too noisy to interpret?
FAQ
Why is my Apple Watch HRV different from Oura or WHOOP?
The devices may use different HRV calculations, sampling times, sensor locations, filtering rules, and daily summaries. Apple Health identifies HRV as SDNN, while other recovery platforms commonly emphasize RMSSD during sleep.
Which wearable has the most accurate HRV?
Accuracy depends on the device, conditions, signal quality, and reference method. For everyday tracking, consistent wear and trends within one validated system are usually more useful than comparing absolute values across brands.
Can I combine HRV data from different devices into one baseline?
Usually not without careful validation because the values may not be equivalent. Mark the device change, allow the new platform to establish its own baseline, and compare directions rather than joining the raw numbers into one continuous series.
*This article is for informational purposes only and is not a substitute for professional medical advice, diagnosis or treatment.*
Related articles

POTS and Wearables: What Standing Heart-Rate Patterns Can—and Can’t—Tell You
A watch can document how heart rate changes after standing, but a POTS evaluation also needs symptoms, blood pressure, timing, and alternative causes. I explain how to build a concise record for a clinician without turning a smartwatch into a diagnostic device.

Your Menstrual Cycle Changes Recovery Scores—Here’s How to Read the Pattern
Recovery, temperature, resting heart rate, HRV, and sleep can follow repeatable patterns across the menstrual cycle. I explain how to compare several cycles so a familiar monthly shift is not mistaken for a new health crisis.

Can dehydration raise your heart rate and ruin recovery?
For ten days last summer I was convinced I had overtrained. My resting heart rate was up, my easy runs felt hard, and cutting my training volume changed nothing. The problem was water. Here is how fluid loss raises your heart rate, why it drags out recovery, and how to tell it apart from everything else that does the same thing.
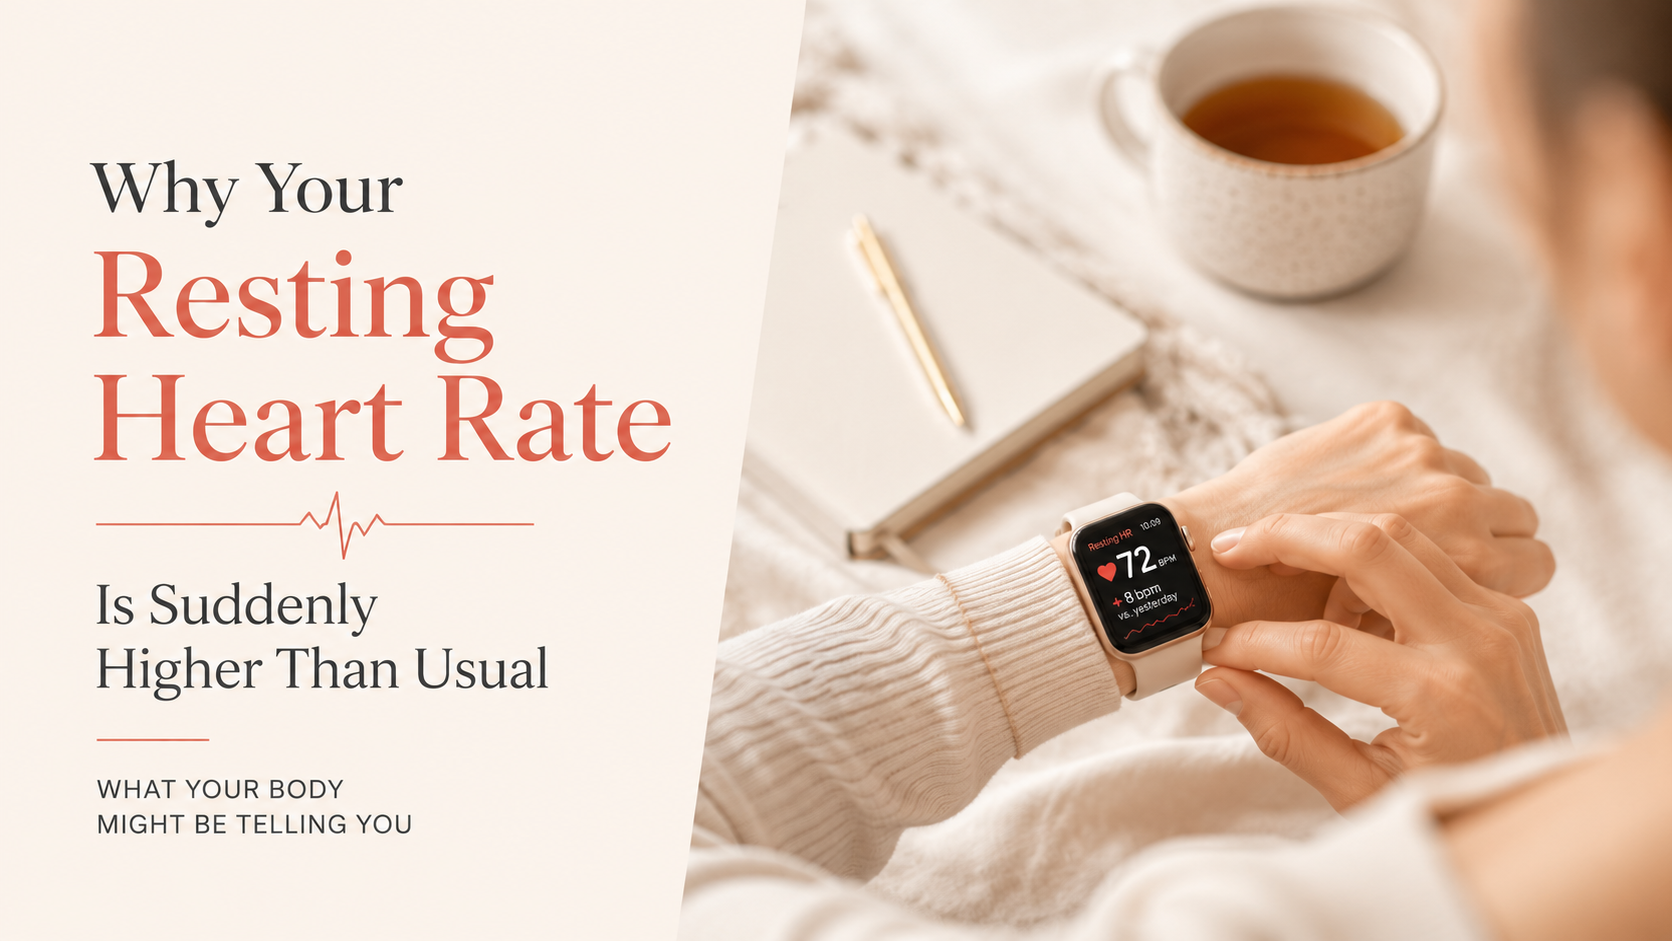
Why Your Resting Heart Rate Is Suddenly Higher Than Usual
A resting heart rate that jumps five or six beats and stays there is usually explained by the week, not the heart. Here's how I work through the usual causes, why one high night matters far less than three, and where the line sits between tracking it and calling someone.
Best Apps That Explain Sudden HRV Changes in 2026
Why your HRV changed overnight, what it usually means, and the apps that actually help you figure out what to do next.
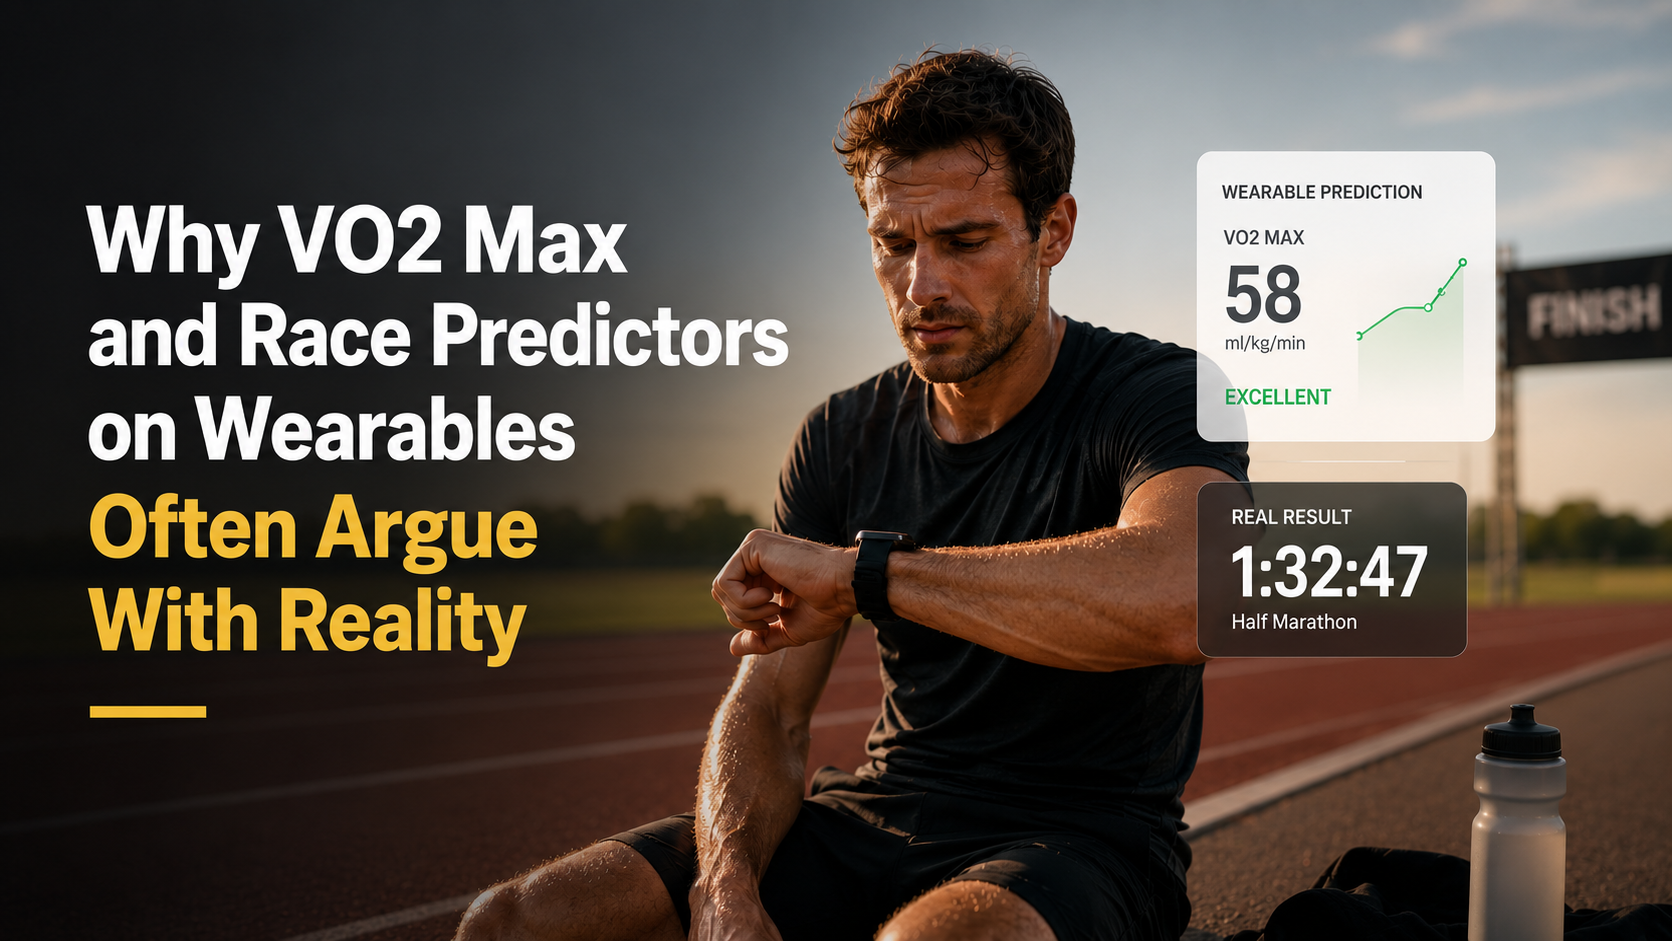
Why VO2 Max and Race Predictors on Wearables Often Argue With Reality
Your watch never measured your VO2 max, it guessed it from heart rate. Here's why that number drops in summer, why the race predictor lies, and how to read both.
Why heart rate alone doesn't explain strength training
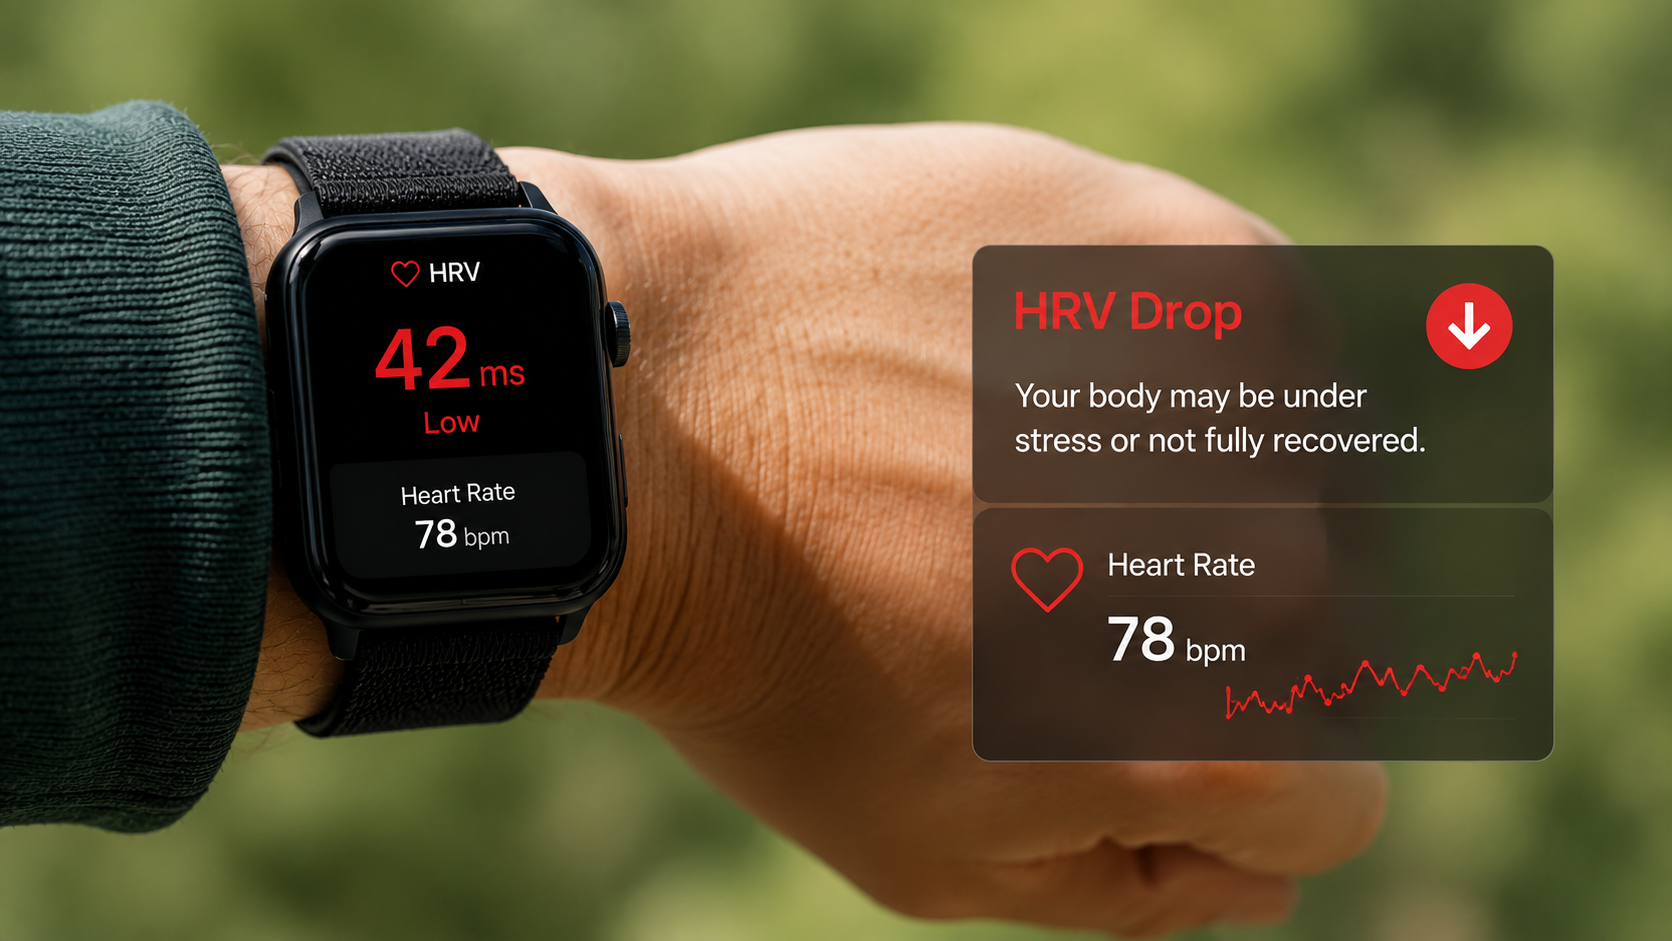
What Does an HRV Spike or HRV Drop Actually Mean?
An HRV spike isn't always good and a drop isn't always bad. Here's why your HRV changed overnight, and when low HRV is stress, sickness, alcohol, or just noise.