Why the Shape of Overnight HRV Matters More Than One Sample
By Mr.Apps · Sep 21, 2026
Category:HRV

One sample is a narrow view
I treat an overnight HRV value as one observation inside a larger record. It may be useful, but it cannot describe the whole night by itself. The timing of the sample, the conditions around it and the rest of the trace determine how much meaning it can carry.
The shape of an overnight record can add context that an isolated value lacks. A trace may remain broadly stable, drift gradually, change in several stages or contain gaps. Those shapes do not prove a cause. They show how the measured signal behaved during the available window.
Wearable measurements also need a quality check. A clinical review recommends putting wearable readings into context and checking for acquisition problems. The graph should invite a careful question, not create a clinical conclusion.

Look at direction and stability
When I review an overnight HRV pattern, I ask whether the trace is broadly stable, gradually changing or interrupted by unusual points. A stable shape may support a comparison with the person's recent pattern. A gradual change may deserve attention to timing and other contributors. A sudden isolated jump may be less useful if it is not repeated or supported by the record.
The direction is not automatically good or bad. HRV varies between people and within the same person. A higher value does not prove better recovery, and a lower value does not identify a specific problem. The trace is context for a broader review.
An overnight pattern also has a time axis. A value early in the night may not answer the same question as a value later in the night. If the app offers a graph, note where the sample sits and whether the window was complete. A single number without timing loses information.
Separate the trace from the interpretation
A graph is a representation of recorded or estimated data. It is not a direct view of the nervous system, and it is not a diagnosis. The service may smooth, filter, interpolate or summarize the raw measurements before displaying them.
This distinction becomes important when the line looks persuasive. A smooth curve can still depend on sparse data. A sharp point can be caused by measurement conditions rather than a meaningful physiological change. A review of wearable technologies notes that accuracy depends on the device, application and conditions of use.
Use the graph to ask what happened in the record. Did the sensor have consistent contact. Was the person moving. Did the device sync the whole period. Was the metric calculated with the same method as previous nights. If the answer is unknown, lower confidence in the comparison.
Check coverage before comparing shapes
Two traces are not comparable when one covers a full night and the other covers only a short segment. A partial trace may appear unusually calm or unusually variable simply because the missing period would have shown something else.
Look for the start and end of the recorded window. Check whether the app identifies gaps or estimates. Note whether the device was worn continuously and whether the source changed. A visible line can hide a missing portion if the interface does not make coverage prominent.
When sleep contributes to the interpretation, preserve its separate measures. Adult sleep guidance treats duration as an independent health-supporting measure. An HRV shape cannot replace the question of how much sleep was available or recorded.
Use the personal baseline as a reference
Overnight HRV has wide personal variation, so I prefer comparison with a person's own recent pattern. A single value above or below a broad population range may be less useful than a consistent change away from the person's usual record.
The baseline still needs a method. If the device, sampling window, body position or calculation changes, the apparent trend may reflect a new measurement process. A personal baseline is meaningful only when the conditions are reasonably comparable.
The comparison should include more than HRV. Sleep timing, duration, resting heart rate, activity, stress and symptoms may change the interpretation. No single trace can explain all of those factors.

Do not force a cause onto a curve
People naturally search for a reason when a graph changes. The change may follow a different schedule, an unusual demand, an illness, a measurement gap or simple variability. The trace alone cannot identify which explanation is correct.
Keep the language precise. Say that the shape changed, not that the graph proves a cause. Say that the trace is consistent with a broader pattern, not that it establishes recovery. Say that the record is incomplete when it is incomplete.
This restraint is part of good data practice. A broad review of consumer wearable technology highlights the need for standard validation of bespoke metrics. A graph can be useful without carrying a stronger claim than the evidence allows.
Read overnight HRV beside the decision
An HRV graph may help with a reversible, low-stakes decision. It can prompt a review of the night's coverage, support a less aggressive optional plan or encourage a comparison with recent records. It should not be used to diagnose a condition or to overrule serious symptoms.
The right decision may be to wait for another complete record. A single unusual trace is often a reason to check the data path and the person's current state before changing a routine. Repetition and context matter more than visual drama.
General wellness metrics also have a defined boundary. General wellness guidance distinguishes healthy-lifestyle functions from claims about diagnosing or treating a condition. Keep the graph in that role.
Use a four-part overnight review
My review has four parts. First, check the time window and gaps. Second, look at the direction and stability of the trace. Third, compare it with the person's recent records under similar conditions. Fourth, consider other inputs and current state before choosing a small action.
This sequence prevents one sample from controlling the interpretation. It also prevents a complicated graph from becoming a reason to ignore useful information. A trace is most valuable when it clarifies what is known, what is uncertain and what should be checked next.
An existing guide on using overnight recovery data after intervals shows why the next-night pattern often matters more than one isolated point. The comparison becomes stronger when the measurement window and the preceding demand are visible.

Keep the graph in perspective
An overnight HRV shape can add detail to a readiness review, but it does not replace judgment. A stable trace may support a stable interpretation, a changing trace may justify a closer look and an incomplete trace may require restraint. None of those statements is a diagnosis.
The graph should help the reader ask a better question: what does this pattern show, what does it leave out and what evidence would make the next decision clearer. That is enough to make an overnight trace useful.
FAQ
Is one overnight HRV sample enough to judge recovery?
Usually not. One sample lacks the direction, stability and timing of the surrounding record. Compare it with the person's recent pattern and check coverage before assigning meaning.
Does a rising overnight HRV trace prove better recovery?
No. A rising trace may be one part of a favorable pattern, but it does not prove a cause or a diagnosis. Review sleep, other contributors, data quality and current state together.
What should I do when the overnight HRV graph has gaps?
Treat the record as incomplete, check the device and sync path, and avoid strong comparisons until a comparable window is available. Seek appropriate advice when symptoms or serious concerns are present.
*This article is for informational purposes only and is not a substitute for professional medical advice, diagnosis or treatment.*
Sources:
Journal of the American College of Cardiology·Digital Health·U.S. Food and Drug Administration·Centers for Disease Control and Prevention·U.S. National Library of Medicine·U.S. National Library of Medicine
Related articles

Why a Positive Metric Change Can Still Trigger a Health Alert
A metric that usually looks favorable can still be unusual enough to trigger an alert. This guide explains why anomaly systems monitor changes in both directions and how to add baseline, timing, and symptom context.

Vagus Nerve “Reset” Techniques: Can HRV Show Whether They Work?
HRV can show an immediate response to breathing, cold, or stimulation, but it cannot prove that the nervous system has been reset. I compare the main techniques and explain how to test a useful effect without overreading one impressive graph.

Personalized Heart-Rate Zones: Why the “220 Minus Your Age” Formula Often Fails
Age-based heart-rate formulas are convenient, but they can place an individual’s training boundaries far from their real physiology. I explain how resting heart rate, thresholds, field cues, medications, and better testing can produce safer custom zones.

Why Apple Watch, Oura, WHOOP, and Garmin Give You Different HRV Scores
Apple Watch, Oura, WHOOP, and Garmin can report different HRV values without any one device necessarily being broken. I explain how calculation method, sampling time, sensor location, artifact filtering, and baseline logic change the result, and why trends within one device are the safer comparison.

POTS and Wearables: What Standing Heart-Rate Patterns Can—and Can’t—Tell You
A watch can document how heart rate changes after standing, but a POTS evaluation also needs symptoms, blood pressure, timing, and alternative causes. I explain how to build a concise record for a clinician without turning a smartwatch into a diagnostic device.

Your Menstrual Cycle Changes Recovery Scores—Here’s How to Read the Pattern
Recovery, temperature, resting heart rate, HRV, and sleep can follow repeatable patterns across the menstrual cycle. I explain how to compare several cycles so a familiar monthly shift is not mistaken for a new health crisis.

Can dehydration raise your heart rate and ruin recovery?
For ten days last summer I was convinced I had overtrained. My resting heart rate was up, my easy runs felt hard, and cutting my training volume changed nothing. The problem was water. Here is how fluid loss raises your heart rate, why it drags out recovery, and how to tell it apart from everything else that does the same thing.
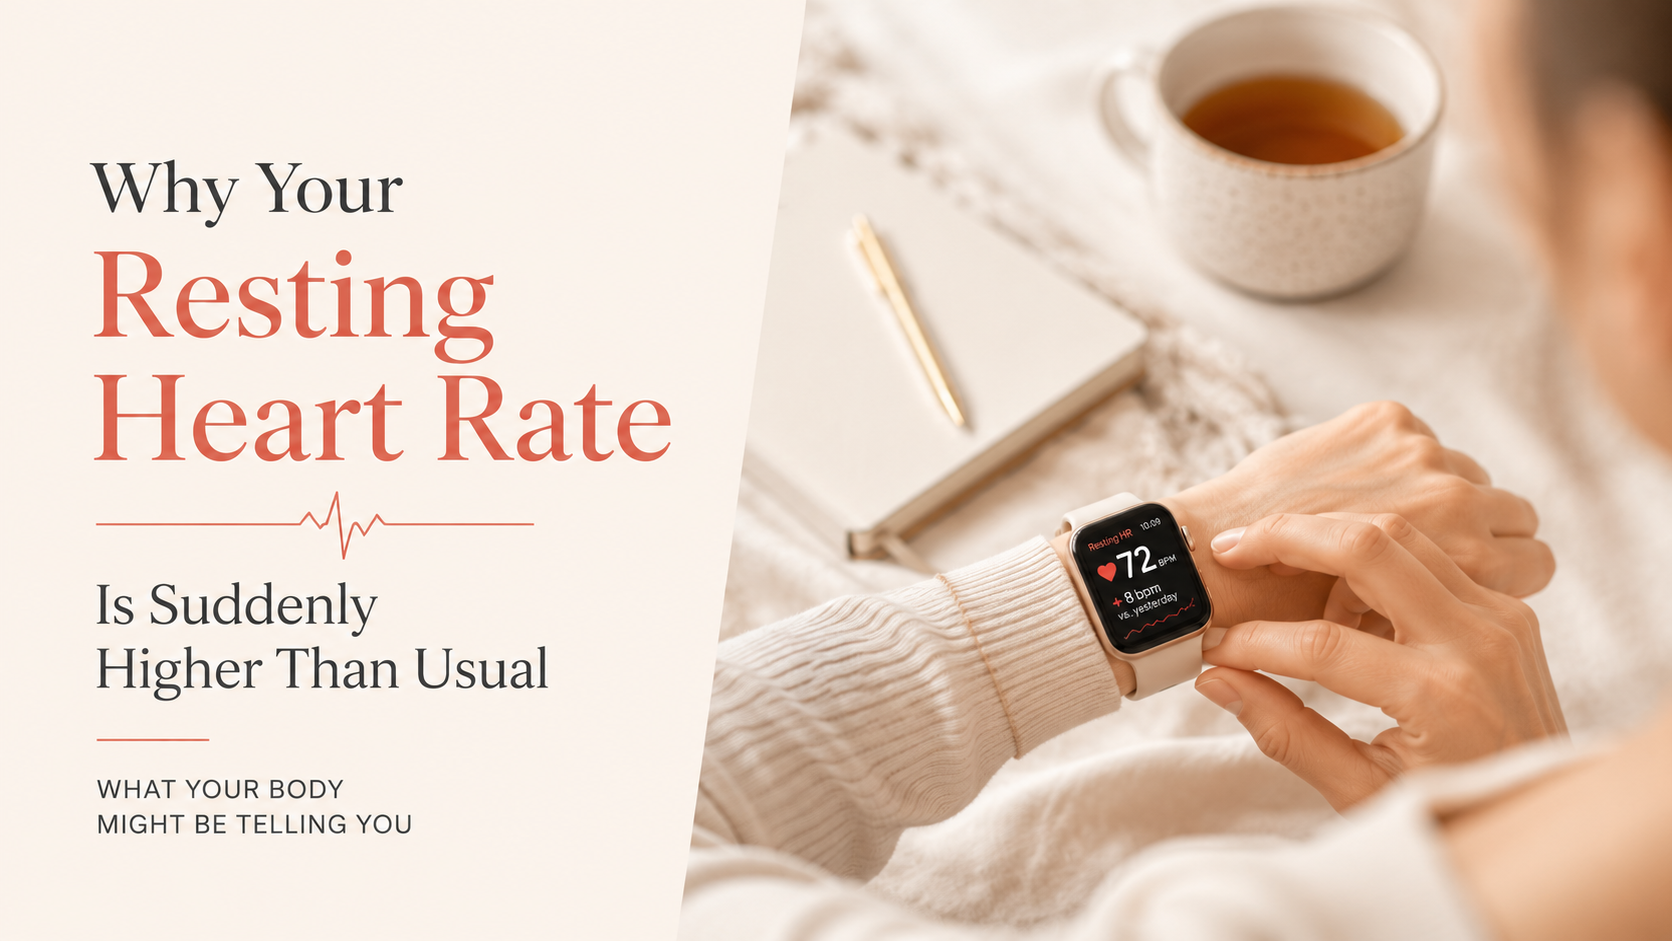
Why Your Resting Heart Rate Is Suddenly Higher Than Usual
A resting heart rate that jumps five or six beats and stays there is usually explained by the week, not the heart. Here's how I work through the usual causes, why one high night matters far less than three, and where the line sits between tracking it and calling someone.
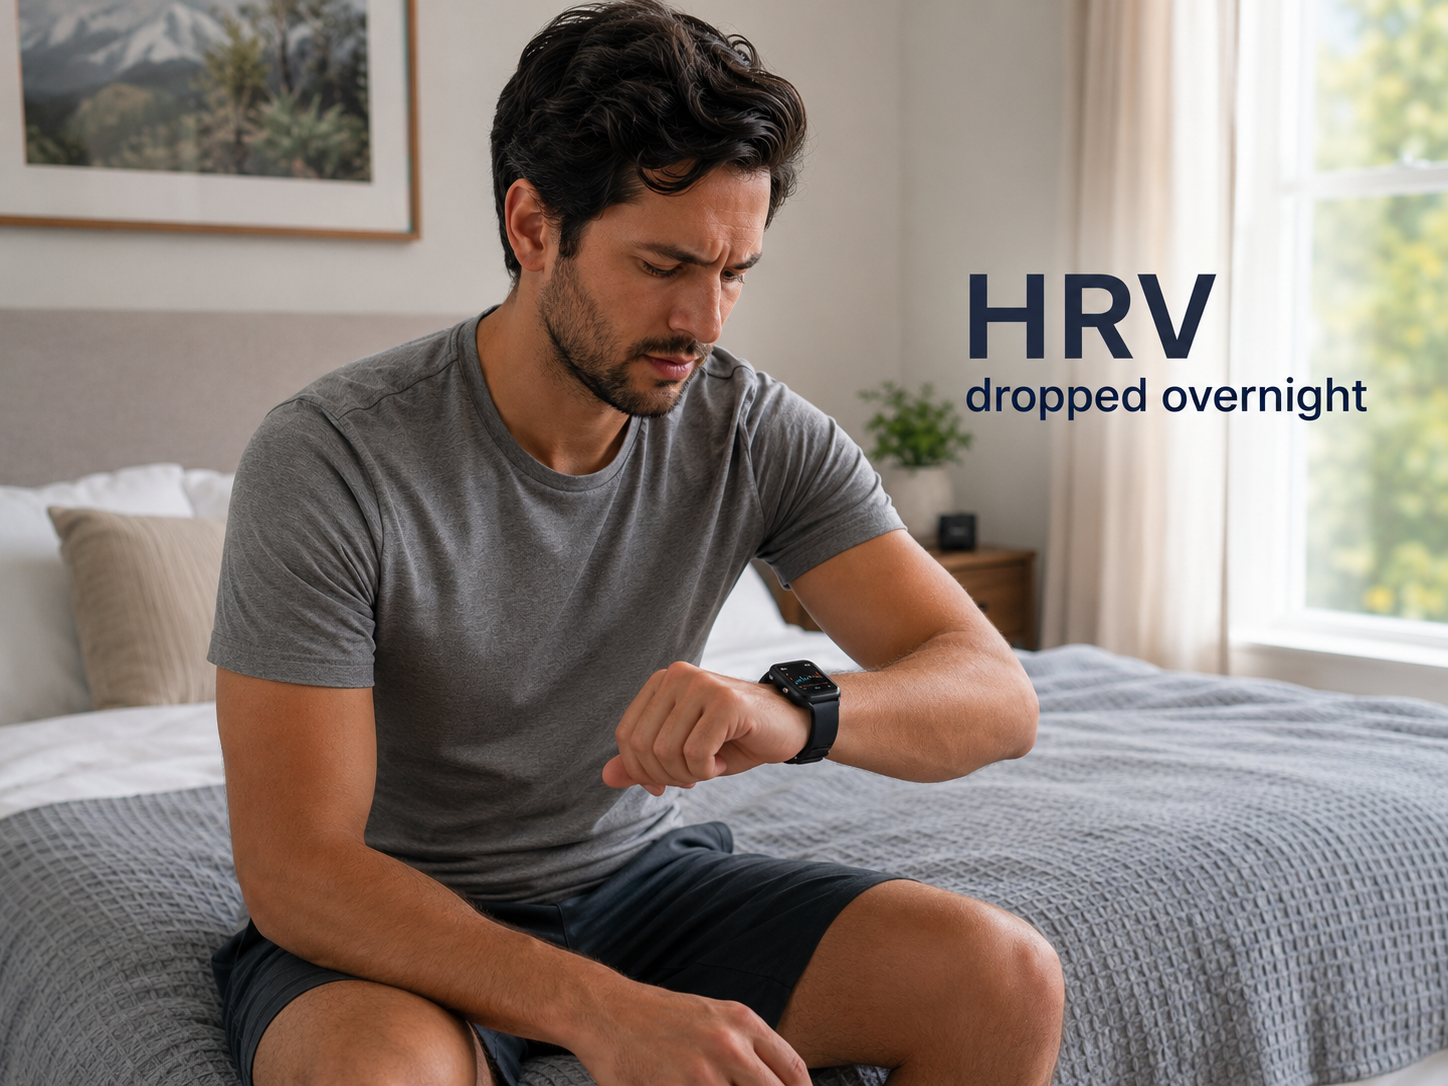
Best Apps That Explain Sudden HRV Changes in 2026
Why your HRV changed overnight, what it usually means, and the apps that actually help you figure out what to do next.
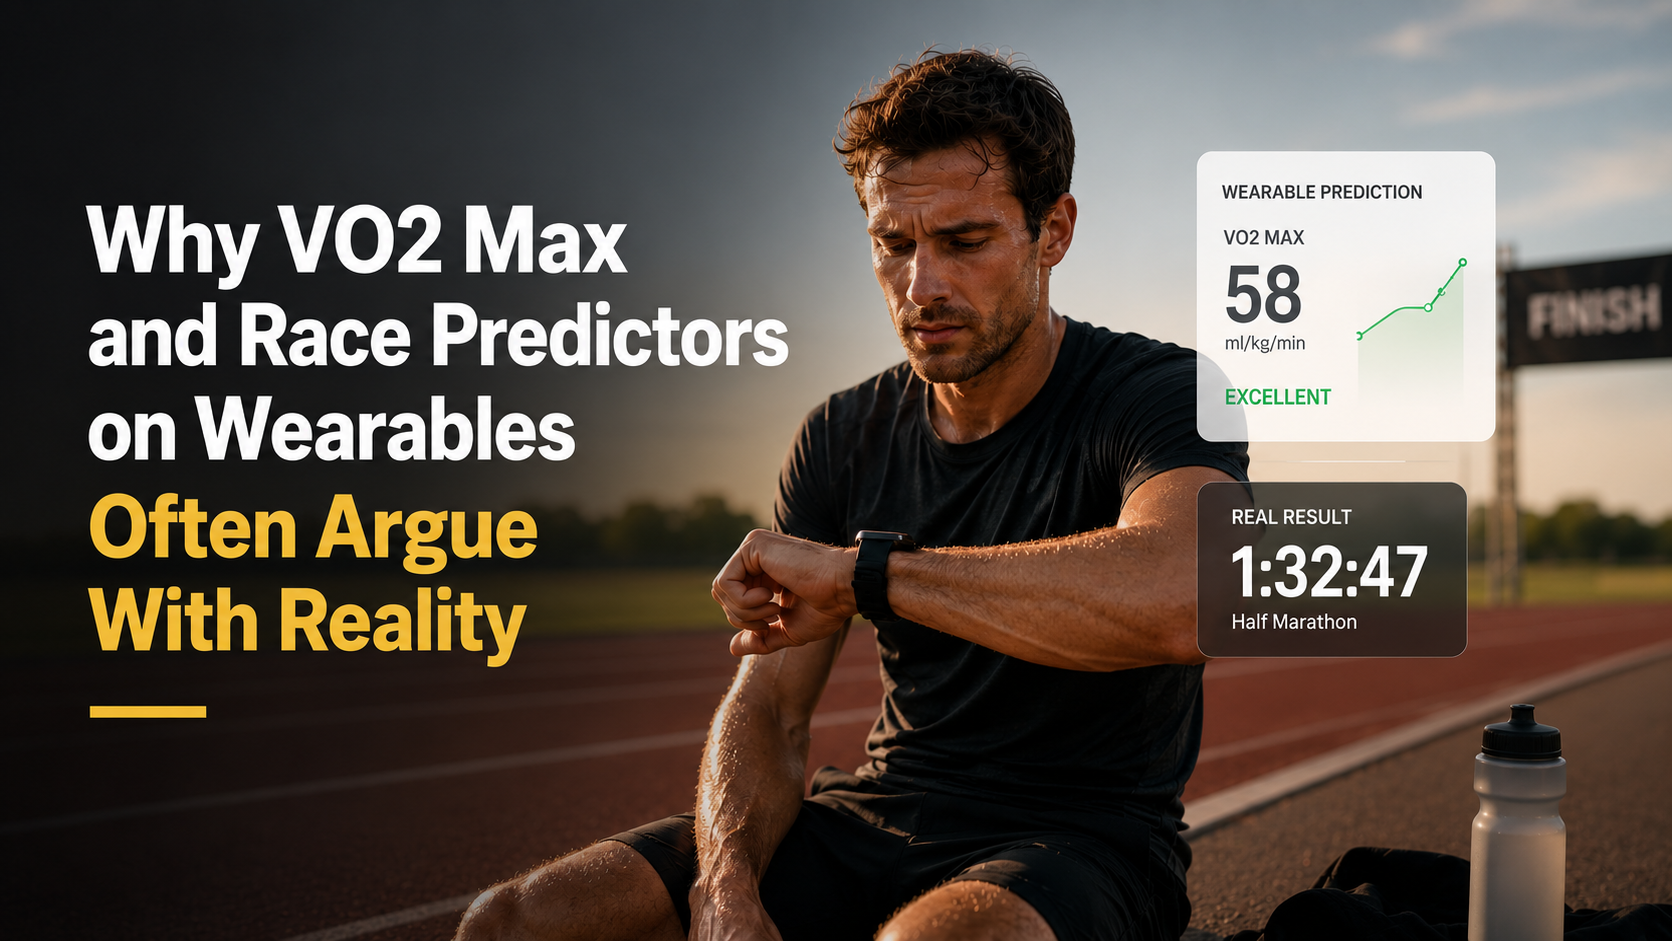
Why VO2 Max and Race Predictors on Wearables Often Argue With Reality
Your watch never measured your VO2 max, it guessed it from heart rate. Here's why that number drops in summer, why the race predictor lies, and how to read both.