Glucose sensor timing can lag behind changes in blood
By Mr.Apps · Nov 2, 2026
Category:Energy
Why a glucose sensor can trail a blood change
Glucose sensor timing can lag behind changes in blood because a continuous glucose monitor samples glucose in interstitial fluid beneath the skin, not directly in circulating blood. The sensor estimates blood glucose from that tissue signal. When glucose is changing quickly, the interstitial reading may reflect a change later than a blood sample taken at the same moment. The size and timing of the difference are not fixed for every device or situation.
Several processes contribute. Glucose moves between blood and interstitial fluid; the sensor has its own response time; and software may smooth or filter the signal. The reading displayed by an app is therefore a processed estimate that represents a recent measurement interval. It should not be treated as a perfectly synchronized blood value.
The study of glucose sensor lag during aerobic exercise compared continuous sensor values with blood glucose measurements in a specific group using particular devices. It found that the apparent delay could remain during exercise. Those results explain why timing matters, but they do not set a universal correction for every person, sensor, or activity.
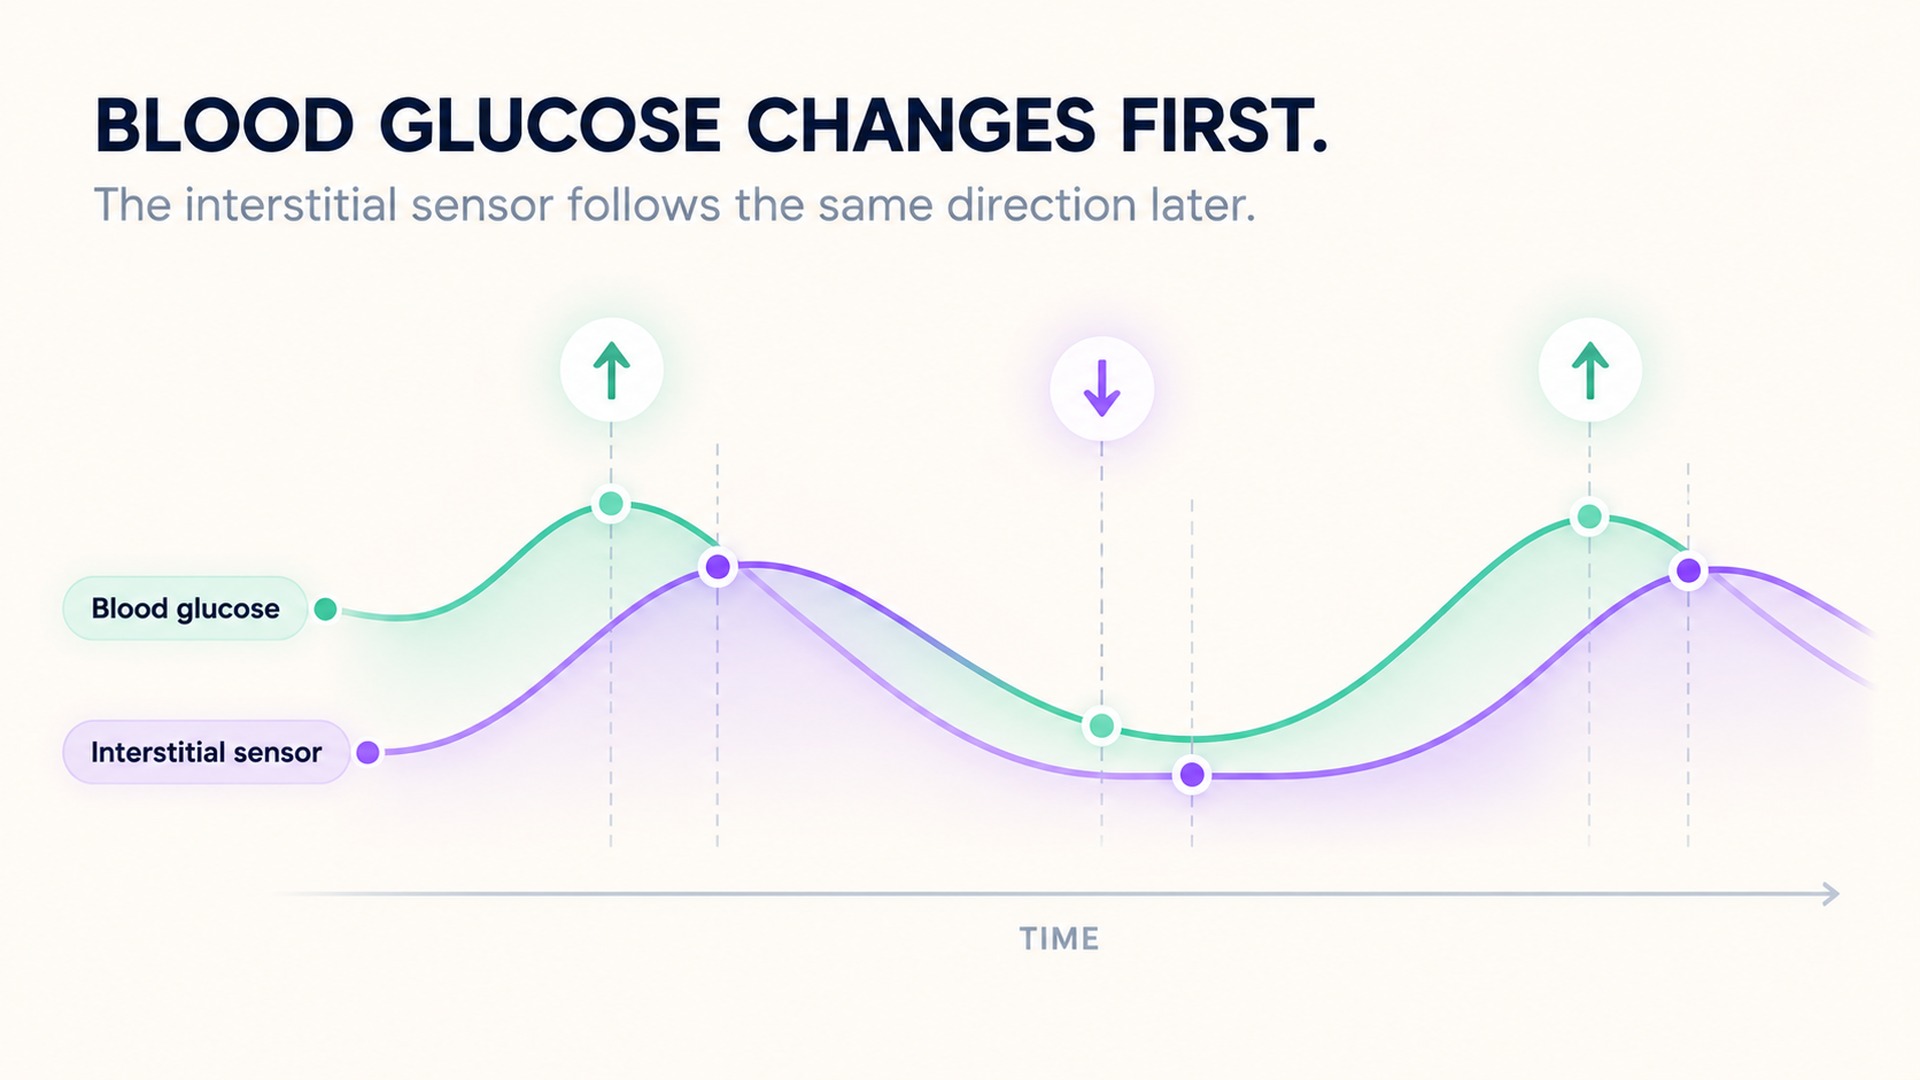
Interstitial fluid and blood answer related questions
Blood glucose and interstitial glucose are connected, but they are measured in different compartments. A fingerstick meter measures glucose in a drop of capillary blood. A sensor placed under the skin measures glucose in the fluid between tissue cells. The two signals often move in the same general direction over time, yet they may not match at a single point, particularly when glucose is rising or falling quickly.
Research has measured this delay in specific sensor systems, and reported timing varies with the sensor and protocol. Those findings show that lag can occur; they do not establish a correction for every current device. New systems use different sensing chemistry, placements, algorithms, and filtering, so an older study cannot be used as a universal adjustment.
The overview of continuous glucose monitoring explains that a CGM estimates glucose at intervals and tracks it over time. This makes it useful for showing patterns that single blood checks may not capture. The time series is still an estimate from a sensor and should be read with its trend arrows, data gaps, device instructions, and care plan.
Why rapid changes make timing more noticeable
When glucose is relatively stable, interstitial and blood readings may appear close. During a rapid rise or drop, the blood signal can change before glucose in the interstitial space and sensor output have caught up. Food, insulin, physical activity, and other physiological changes can affect the rate of movement. The sensor's response and software processing add their own timing characteristics.
The physiology review of interstitial glucose during exercise describes the gap between blood changes and sensor readings as a combination of physiology, technology, and activity. The precise relation can vary with blood flow, tissue site, rate of change, sensor response, and filtering. A time lag does not mean that every unexpected value is explained by lag; other causes of disagreement are possible.
A single pair of readings should therefore be interpreted cautiously. If a sensor value seems inconsistent with symptoms or the device's instructions, follow the instructions supplied with that device and the person's care plan. The guidance on sensor readings that differ from symptoms describes a device-specific situation and actions for that product's users. It does not create one universal rule for all sensors. Do not make a treatment decision from a generic timing correction found online.
Keep the time and method visible
When documenting a sensor pattern, preserve the time, direction of change, trend indicator, sensor site, device, and any relevant context such as recent activity or food. If a blood meter reading is used for comparison, note its time and sample method too. A blood value and a sensor value taken several minutes apart may describe different points on a changing curve.
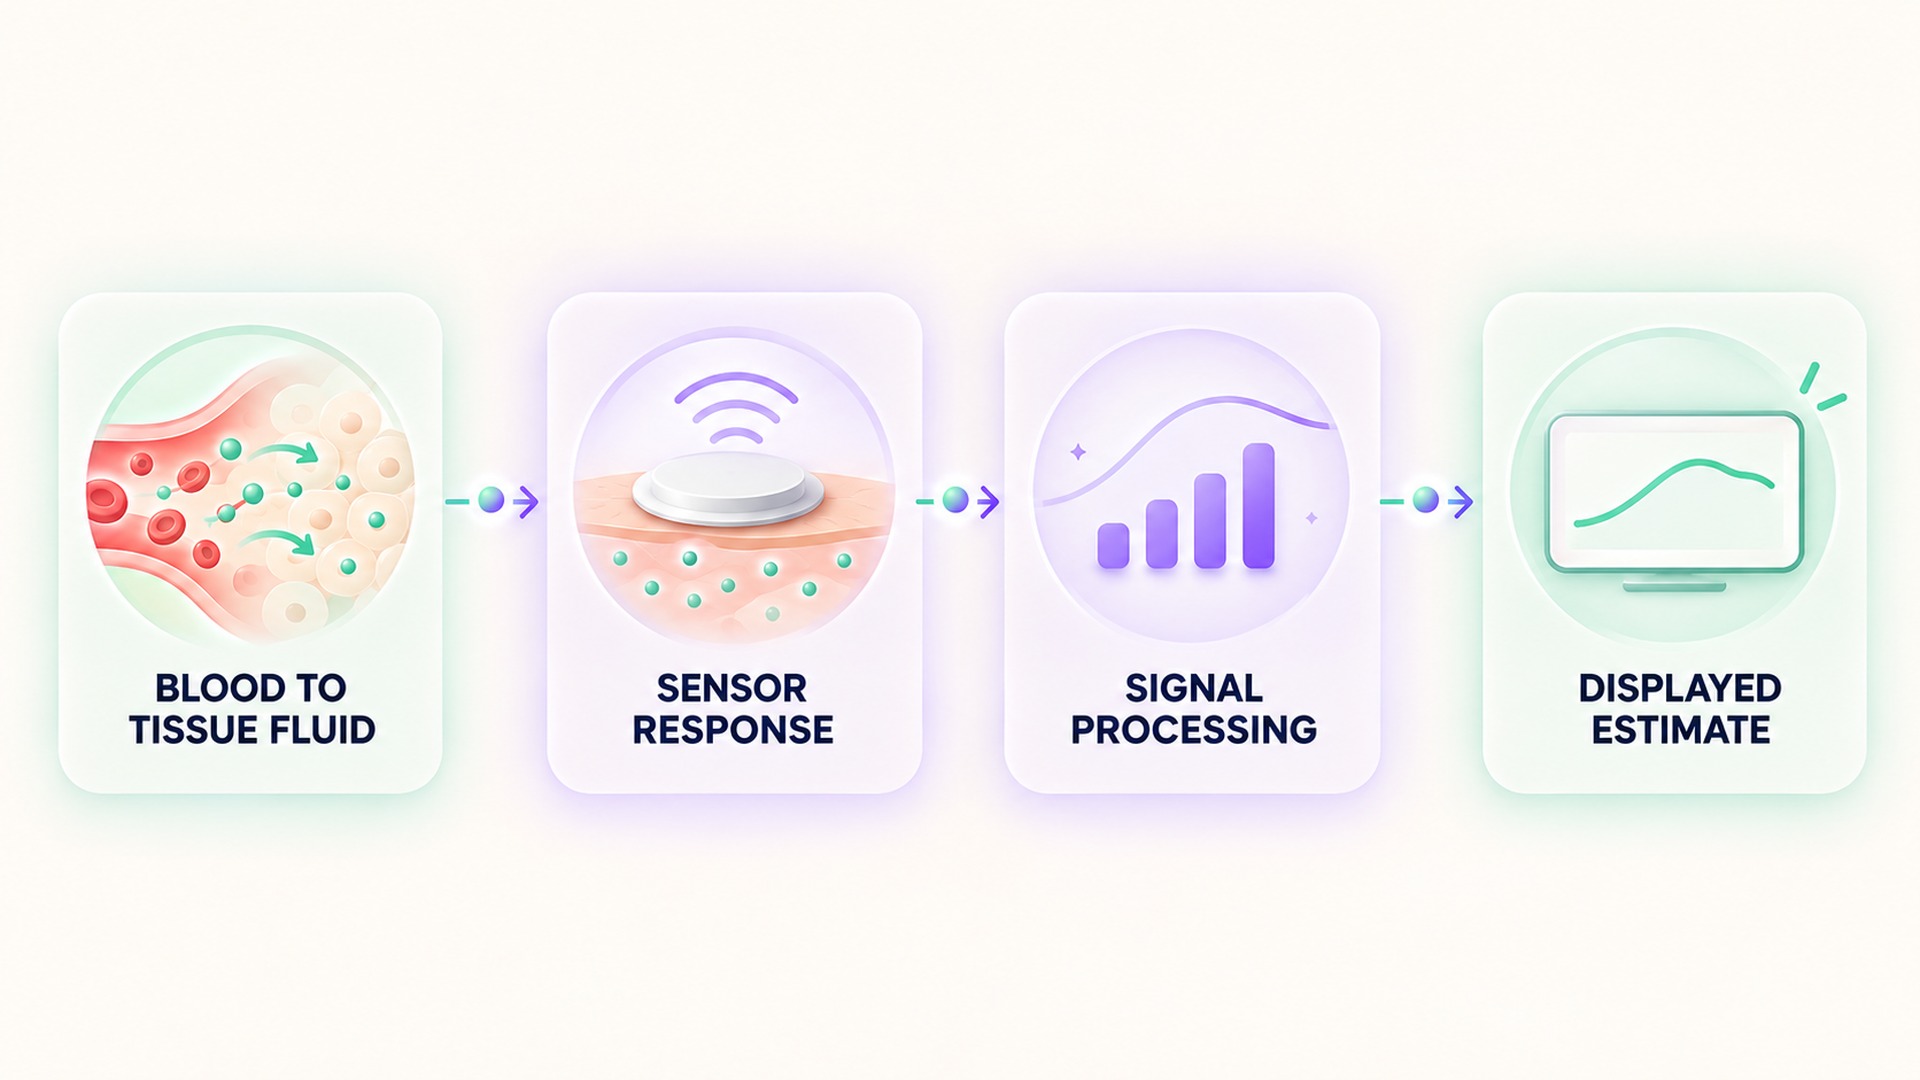
A comparison is most useful when the measurements are close in time and the conditions are recorded. Even then, the result may reflect differences between blood and interstitial fluid, sensor processing, device accuracy, or the blood meter. The research on physiological differences between interstitial and blood glucose found that sensor and blood values can be shifted in time by physiological and instrumental effects. That study describes mechanisms, not a fixed conversion formula.
Timing is one source of disagreement
A difference between a blood meter and a sensor is not always explained by physiological lag. They sample different fluid compartments, and their collection times may not match. A meter reading also has its own sampling and device characteristics. Sensor accuracy can be affected by the placement site, signal quality, warm-up state, pressure on the sensor, and how the system handles missing or noisy data. A timing explanation should not replace a review of the actual report and device messages.
The review of sensor time delay and its causes discusses physiological transport, sensor reaction, and data processing as separate contributors. These components can overlap. A graph may smooth the signal to reduce noise, while the underlying sensor samples at intervals rather than continuously. The displayed point therefore reflects a measurement process with a time window, not an instantaneous draw of blood. The exact process depends on the system.
A trend arrow describes the direction and rate category assigned by the device to its recent data. It is useful context, but it does not reveal the precise blood glucose at that moment or guarantee what the next point will be. If the glucose curve is changing quickly, a displayed trend can be helpful while the current numerical value remains behind the blood change. Follow the device instructions for interpreting its arrows and alerts; do not convert them into a universal time-shift formula.
When making a record, distinguish three times if they differ: when the sensor value appeared, when a blood sample was taken, and when the symptom or activity occurred. Add the sensor site, trend direction, and any device quality notice. A screenshot without time labels can hide the order of events. Keeping these timestamps makes it easier for a clinician to decide whether the mismatch fits a changing glucose pattern, a device issue, or another explanation.
A sensor trend remains useful for showing the pattern over an interval. Its value is not limited to matching one fingerstick at every exact minute. The fairest comparison uses the same time window, clear units, documented sample types, and the current instructions for the devices involved. If the data do not agree, keep both results and the surrounding context rather than editing one to match the other.
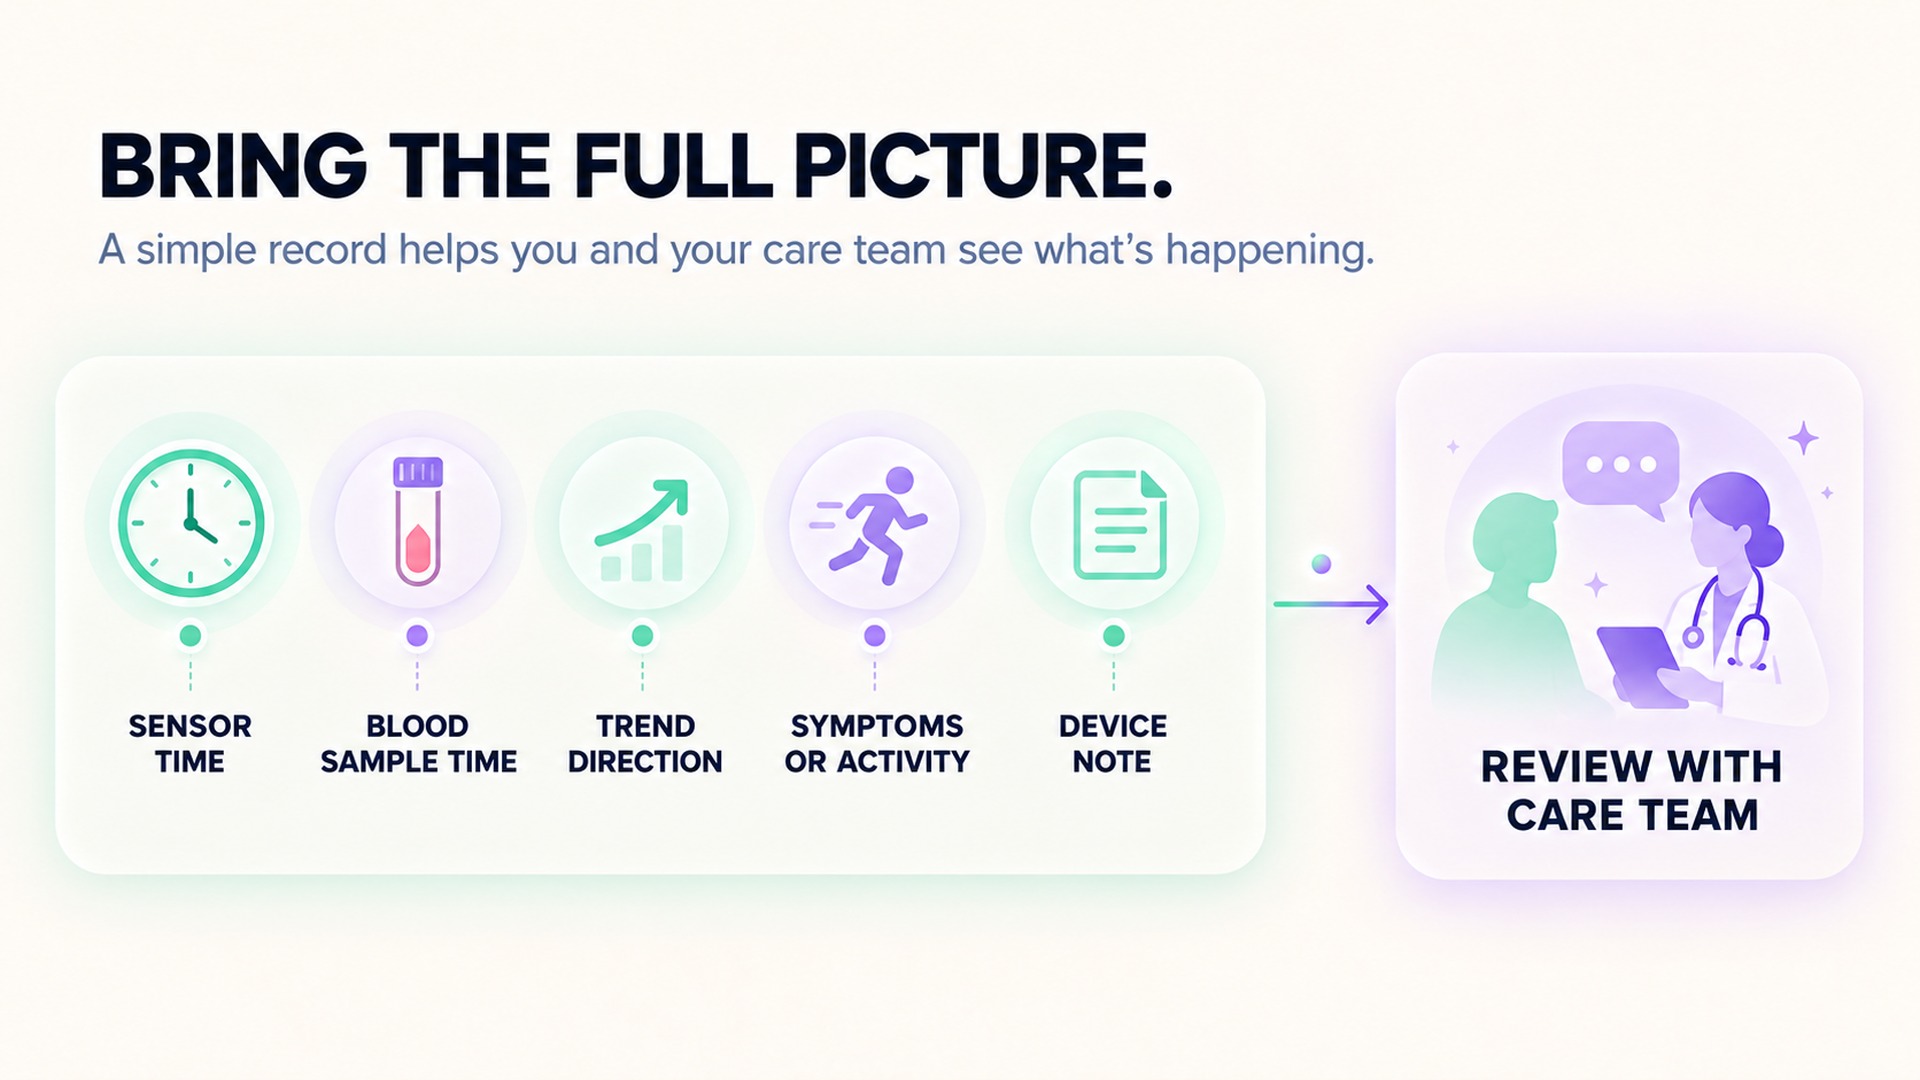
A related guide to continuous and spot measurements explains why a repeated sensor series and a single blood check need separate labels and time windows. This applies to glucose records: keep the sensor estimate, blood measurement, trend direction, and collection times distinct so the care team can understand how they relate.
A chart can look continuous while still containing missing readings or processed estimates. Preserve gaps and device messages rather than interpolating values yourself. If the sensor reports a warm-up, signal loss, calibration prompt, or quality notice, save that message with the time span it affected. A later viewer should be able to tell which data came directly from the sensor and which were missing or estimated.
When comparing days, check the sensor model, site, data coverage, and the time interval shown. Do not assume that two devices or different display settings use the same sampling and smoothing rules. A trend can still help the clinician review patterns, but the exact method and timing remain part of the evidence.
A continuous display also does not mean that every moment is sampled or stored. Some systems report readings at set intervals, smooth a noisy trace, or mark a gap when communication is interrupted. A daily graph may show a line between visible points, but that display should not be mistaken for a direct measurement at every second. Keep any missing-data flags or sensor alerts with the chart, especially when reviewing a brief period around exercise or a meal.
A clear timestamp lets the clinician compare the sensor pattern with symptoms and other readings without assuming the sensor and blood meter captured the same moment.
Frequently asked questions
Do continuous glucose monitors measure blood directly?
No. Most CGM sensors measure glucose in interstitial fluid and estimate blood glucose from that signal. The two values can differ at the same moment, especially during rapid change.
Is there one fixed number of minutes for sensor lag?
No. Timing depends on physiology, the sensor, its site, the speed of glucose change, and signal processing. A finding from one device or study should not be used as a universal correction.
What should I do if the sensor reading does not fit how I feel?
Follow the specific device instructions and the care plan from the clinician. Record the sensor value, time, symptoms, trend indicator, and any other measurement so the clinical team can review the context.
*This article is for informational purposes only and is not a substitute for professional medical advice, diagnosis or treatment.*
Sources:
Diabetes Technology & Therapeutics·National Institute of Diabetes and Digestive and Kidney Diseases·Nutrients·U.S. Food and Drug Administration·Diabetes Care·Journal of Diabetes Science and Technology
Related articles

Peak flow and spirometry report different breathing measures
Peak flow records the highest expiratory flow from a forceful breath out. Spirometry measures airflow and exhaled volume over time, so the test name, units, effort quality, and report comments should stay with each result.
A resting metabolic rate test depends on the test protocol
A resting metabolic rate test estimates energy use from gas exchange under defined conditions. The preparation, equipment, analysis method, and report details all affect how the value should be interpreted.
Bone density T-scores and Z-scores use different references
A T-score compares bone density with a young-adult reference, while a Z-score uses a more closely age-matched reference. Keep the score type, skeletal site, and report interpretation together because the two numbers are not interchangeable.

Waist measurements need a consistent anatomical landmark
Waist circumference can differ when the tape crosses different anatomical sites or follows a different plane. Keep the landmark, posture, breathing phase, and tape position with each date so a trend uses a consistent protocol.

Lean tissue on a body scan includes more than muscle
A body-composition scan reports method-dependent compartments such as lean soft tissue, not a direct count of skeletal muscle. Keep the exact scan label, body region, method, date, and testing context with the result before comparing it over time.

Urine albumin concentration needs its creatinine context
A spot urine albumin concentration changes with how diluted the sample is. The albumin-to-creatinine ratio adds context, while the full report and clinical question still guide interpretation.

A hemolyzed blood sample can complicate a potassium result
Cell damage during collection or handling can affect a measured potassium value. Keep the sample-quality comment with the report and have the result reviewed in its clinical context.

Biotin supplements belong in the record before a blood test
Biotin in supplements can affect selected laboratory assays, and the effect depends on the method used. A clear product, amount, and timing record helps the testing team decide whether an assay-specific review is needed.

A post-vaccine HRV change is not a personal immunity test
A wearable HRV change after vaccination can describe a physiological signal, but it cannot measure antibodies or personal protection. Learn why study associations, symptoms, and immune status answer different questions.

Vitamin D blood levels should not become an automatic supplement dose
Learn what a vitamin D blood test measures and why the result does not automatically set a supplement dose. See how symptoms, medicines, testing reason, and health history shape interpretation.