Time in glucose range needs the target range beside it
By Mr.Apps · Nov 2, 2026
Category:Energy

Why the target belongs beside the percentage
Time in glucose range needs the target range beside it because the percentage depends on the lower and upper glucose bounds used in the calculation. A time-in-range result summarizes how much of a stated period the sensor estimates glucose was within a specified interval. Without the interval, units, and reporting window, the percentage cannot be interpreted on its own.
The same glucose trace can produce different time-in-range percentages when the selected bounds change. One report may use an interval intended for a diabetes-care metric; another may display a user-selected range for a personal chart. The number should not be treated as a universal wellness score or a diagnosis. I keep the exact interval and the population it is intended for with the result.
The 2026 clinical standards for glycemic goals describe time in range alongside time below range, time above range, sensor wear time, and other CGM measures. The report's metrics work together. A single percentage does not show the amount of missing data, time below range, or the clinical question being evaluated.
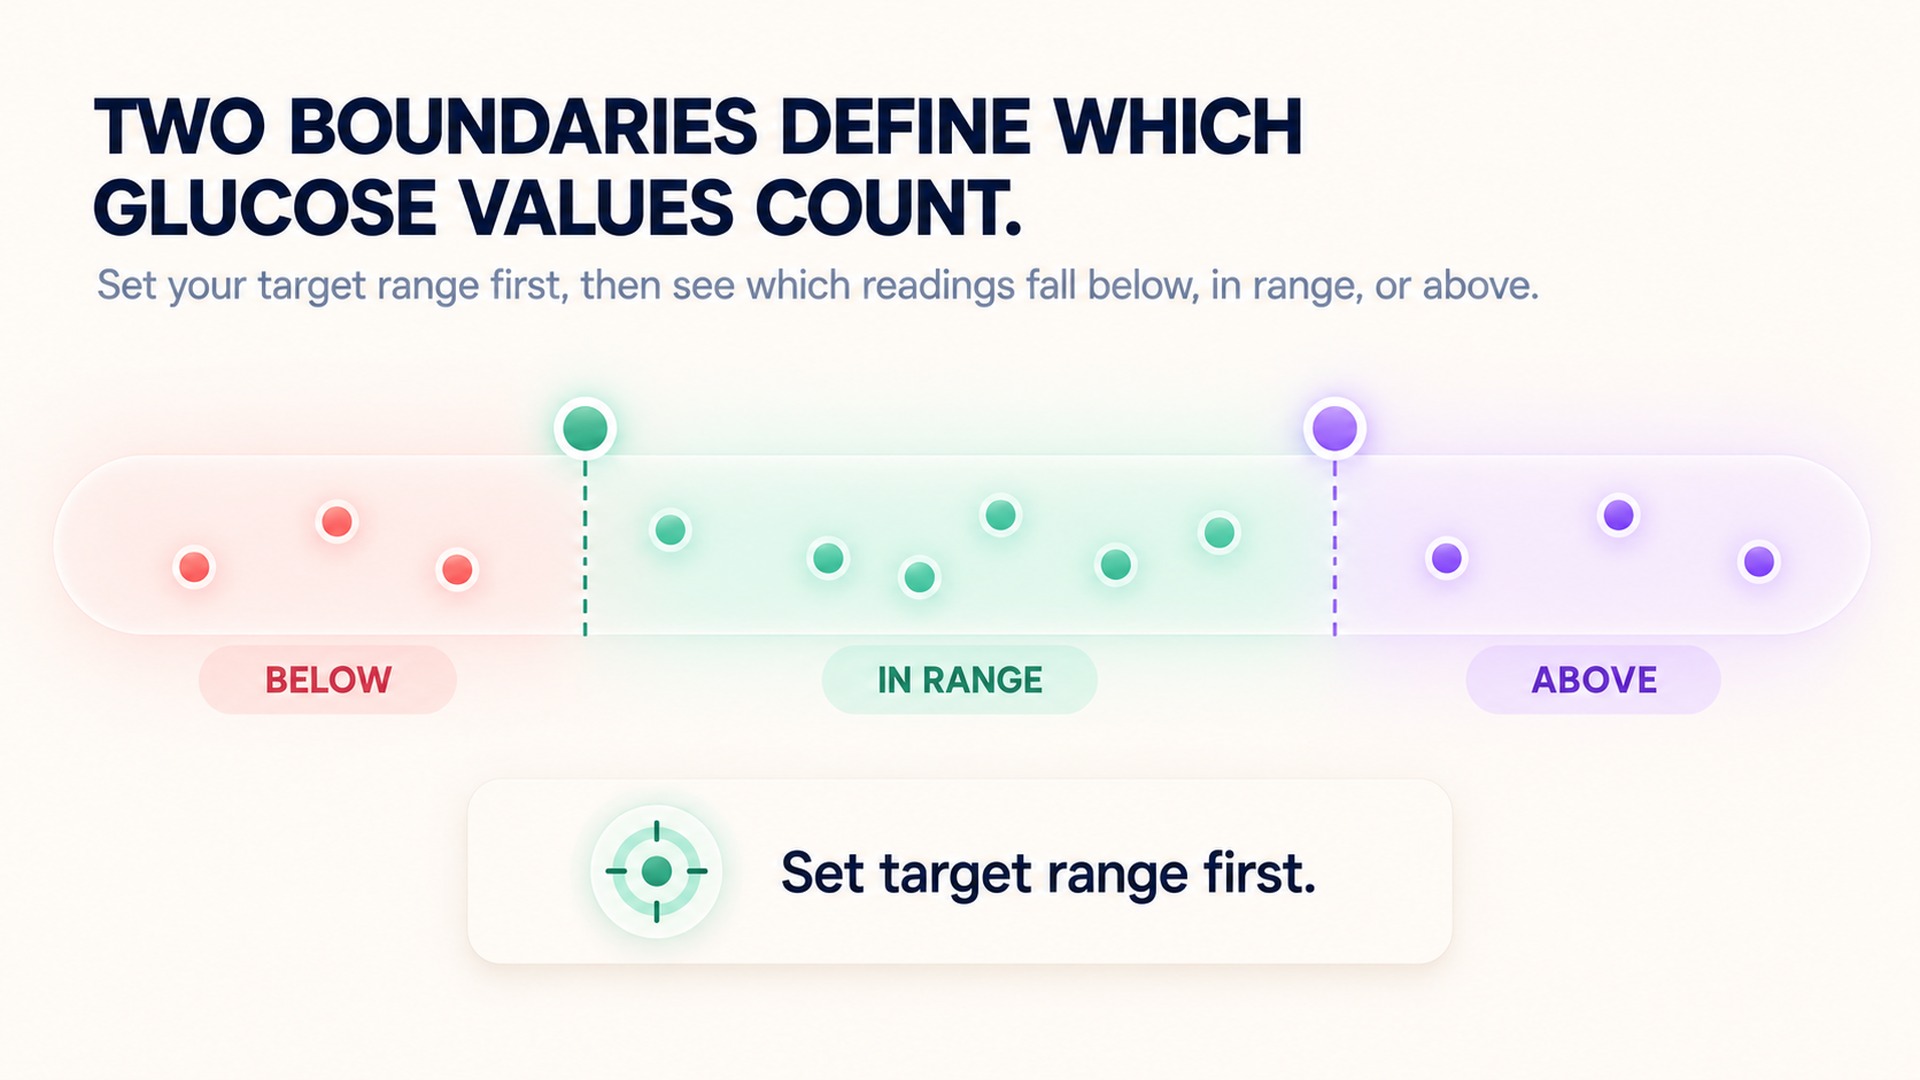
Define the interval before comparing results
A target interval has a lower boundary and an upper boundary, along with units. For example, a report may display milligrams per deciliter or millimoles per liter. Those unit systems express the same underlying glucose concentration with different numbers. A range shown without its unit can be misunderstood, and a range without its boundaries leaves the reader unable to tell which readings counted as “in range.”
Time in range is calculated over a defined observation window. A daily view, a two-week summary, and a longer-term chart answer different questions. A two-week summary may help show a recent pattern, while a single day can be strongly shaped by one unusual event or missing readings. Keep start and end dates visible and avoid comparing windows that cover different parts of a routine without noting the difference.
The international consensus on standardized CGM metrics defines time in range with the paired measures of time below and above range. It recommends reporting the range and other core metrics together for clinical care. The interval itself is part of the definition, not optional metadata that can be left off a chart.
Data coverage changes what the percentage represents
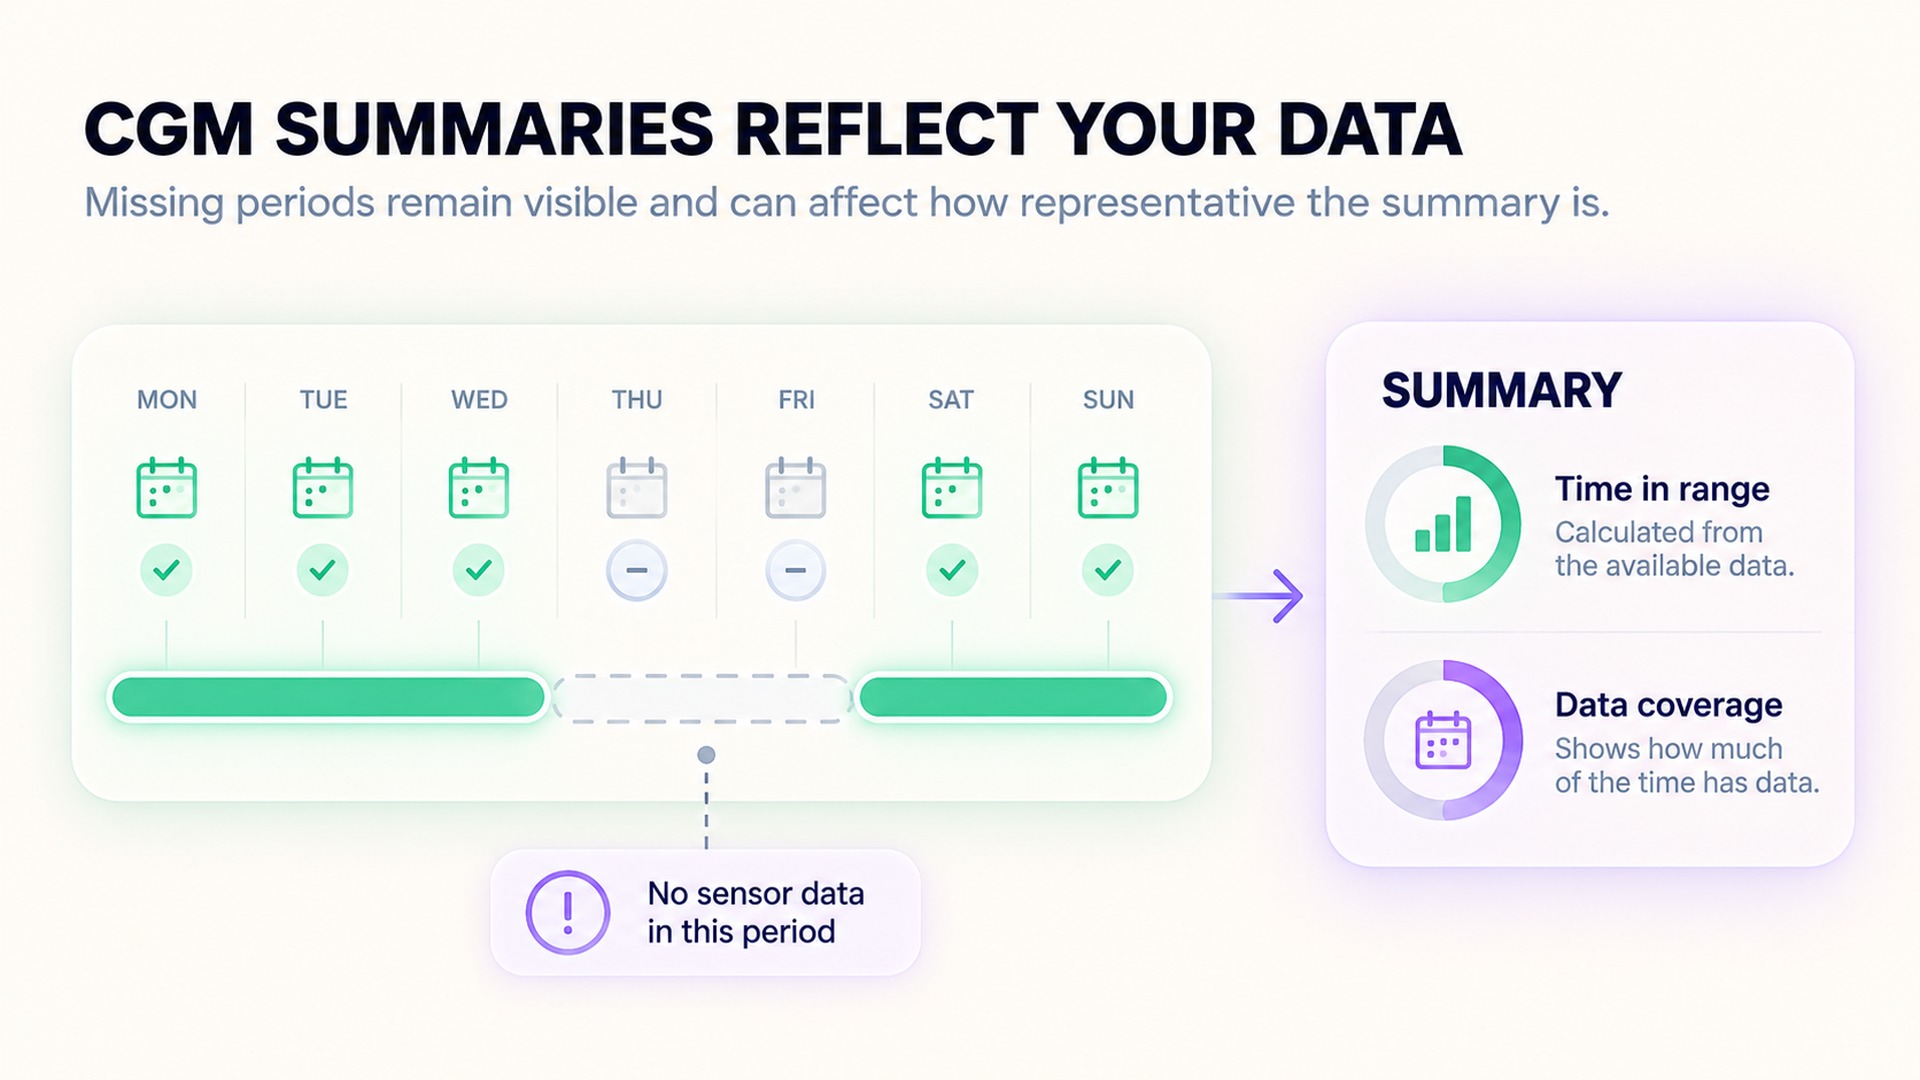
A percentage is based on the sensor readings available for the chosen interval. If the sensor was active for only part of the period, the result describes that available portion. Long gaps may overrepresent the hours or days that remain, especially if missing time is concentrated around sleep, exercise, meals, or another part of the routine. A chart can still look smooth while the underlying coverage is incomplete.
The clinical guide to CGM targets notes that clinical targets are intended for people with diabetes and should be applied in the context of care. A separate consensus on CGM data completeness describes a commonly used reporting window and minimum sensor coverage for retrospective pattern analysis. These are clinical reporting recommendations, not proof that every individual's record is complete or representative.
The public overview of continuous glucose monitors defines time in range as the percentage of the day glucose is within a target range. It also emphasizes that the target and interpretation belong in a health-care context. If the device reports active sensor time, missing data, or a shortened window, preserve those fields alongside the percentage.
What a single percentage leaves out
Two reports can show the same time-in-range percentage while describing different patterns. In one, most readings outside the target may be above the upper boundary; in another, more time may be below the lower boundary. Those patterns have different clinical meaning. The standardized report therefore includes time below and above range as separate measures, along with mean glucose and variability. A percentage in range is one part of the profile, not a summary of every feature the sensor recorded.
An all-day percentage can also conceal when readings fall outside the range. A morning period, overnight interval, and post-meal period may contribute different patterns to the same daily summary. A time-of-day graph can help a clinician see these distributions, but the display still represents the selected reporting interval and available sensor data. If an app provides only one overall number, keep the detailed report or note that the daily percentage is the only view available.
A target boundary is a rule for classifying each reading, not a biological wall. A result just below a selected lower limit and one well below it may both be counted as below range in the simple percentage. The same applies above the upper limit. The separate time-below and time-above metrics and the underlying trace can preserve some of that detail. A daily value should not be used to infer a specific event without looking at the time-resolved data and its gaps.
How to compare periods fairly
When reviewing two time-in-range summaries, first check that both used the same target interval, units, reporting duration, sensor type, and definition of active data. If one summary spans a short interval and another spans a longer period, changes in routine or illness can affect the mix of readings. A different target interval changes which points count, even when the raw sensor data are unchanged. Mark that change rather than presenting the new percentage as a direct continuation of the earlier series.
Check whether the report counts time or individual sensor readings and how it handles missing values. Many displays present percentage of time, but underlying sensors collect at intervals and may have gaps. The calculation method can affect the denominator if only valid readings are included. Read the device's report notes and data-coverage summary before comparing percentages across platforms or reports. Do not assume every app uses the same sampling frequency or gap-handling rule.
If the sensor was active less during a particular period, the visible data may overrepresent the parts of the day when it was worn. For example, gaps around sleep, exercise, or meals can leave those parts of the pattern less certain. Missing data should remain missing in the record; filling gaps with an estimated value can make the percentage appear more precise than the underlying observation. The clinician can decide whether enough data were captured for the intended question.
A range may also be adjusted as part of a clinical plan. If the care team changes it, record the new bounds and the date they took effect. Keep earlier summaries under the earlier target. Otherwise, a difference in reported time in range could come from a changed definition rather than a changed glucose pattern. This is particularly important when a patient or clinician compares reports generated by different software settings.
Clinical targets are not universal wellness goals
For many adults with diabetes, clinical guidance uses a defined interval and a target proportion of readings or time within that interval. The current standards also describe different goals for groups such as older adults with complex health needs. The appropriate target is individualized, with the care team considering the person's treatment, risk, and circumstances. These values should not be turned into a universal standard for every adult, including people who use a sensor for general curiosity.
The clinical application review of time-in-range metrics explains how time in range can complement other measures in diabetes care. It does not make one percentage suitable for every population or purpose. A wellness chart may use a customized interval; that does not make it equivalent to a clinically agreed diabetes target.
For a broader example of why the time window matters, a related article on a monthly metabolic trend and one meal explains that an aggregate trend cannot identify what happened during one specific event. Time in range is also an aggregate. It summarizes a period but does not show every excursion or explain the cause of a pattern.
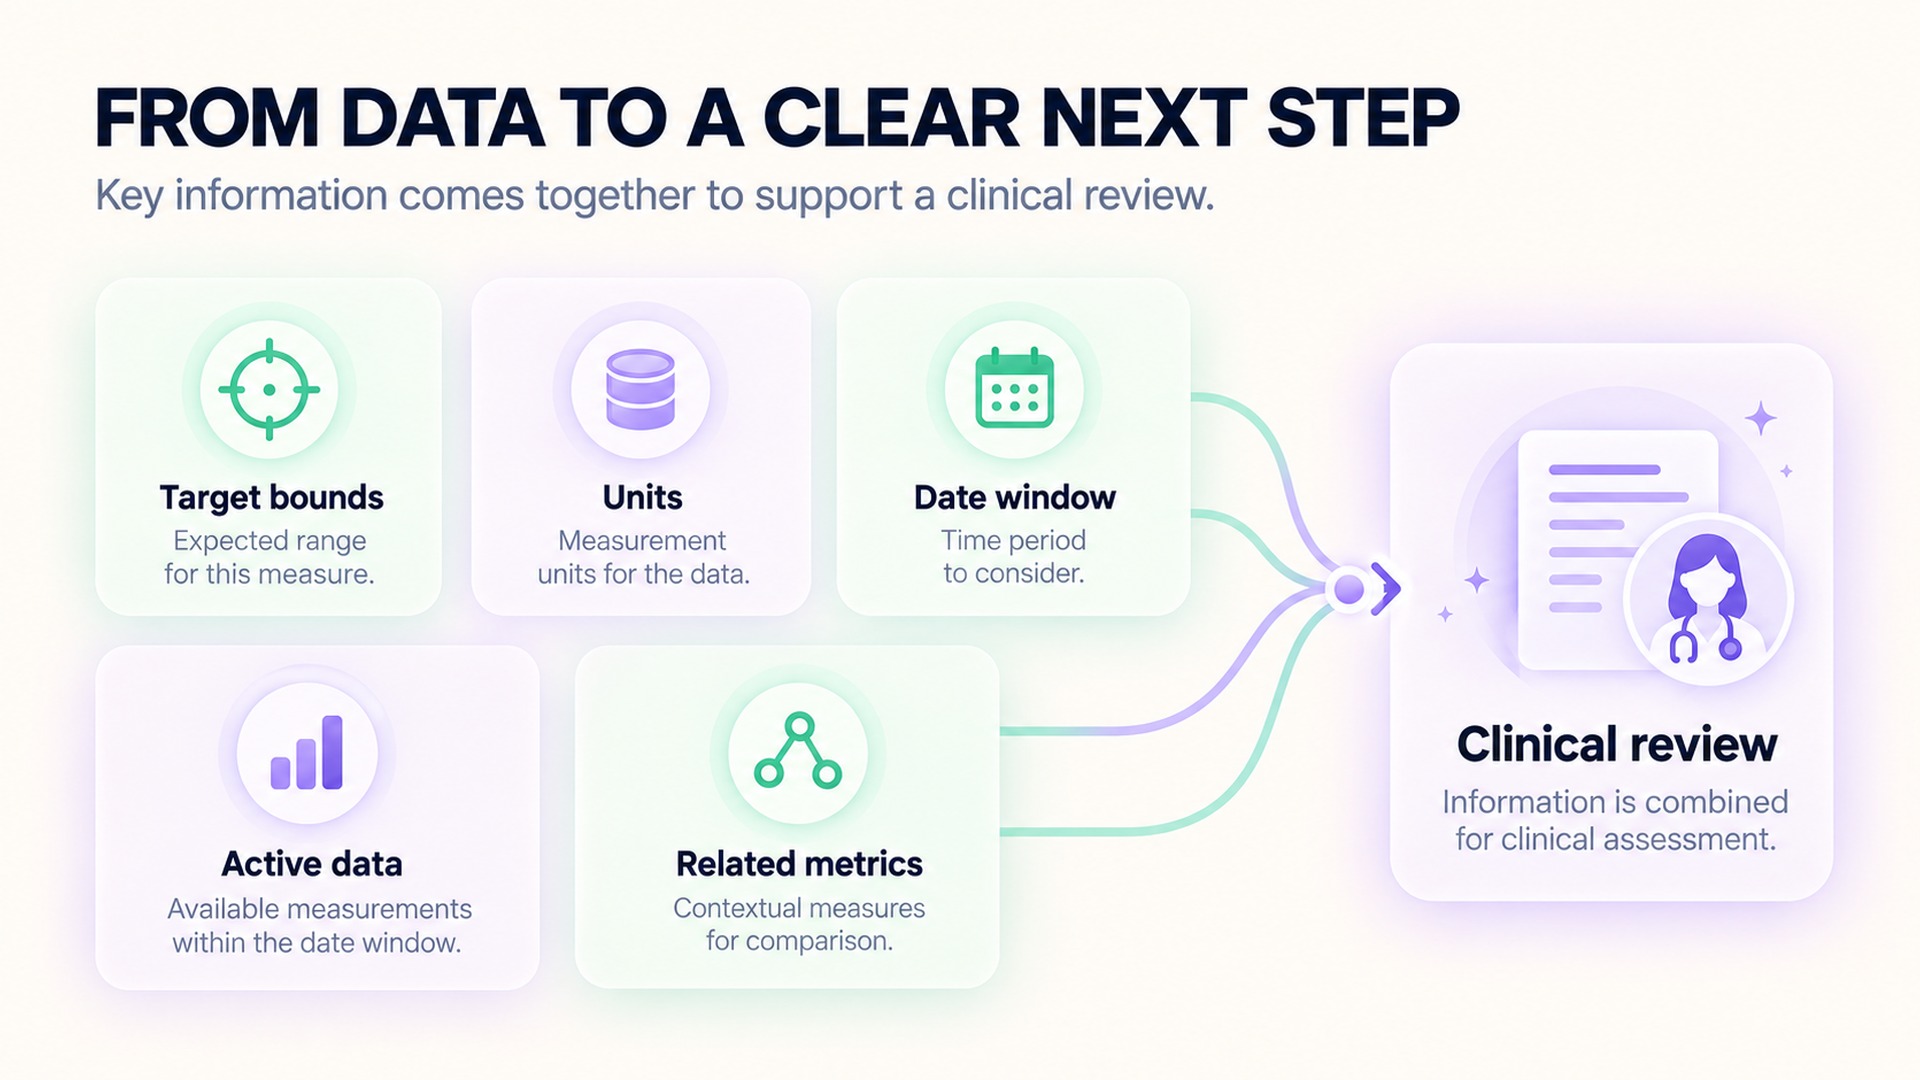
A useful record keeps the percentage, boundaries, units, dates, active sensor coverage, and the report's other metrics together. Save the device's full report if possible. If an app rounds the result, label it as a rounded summary and retain the original figure. If the selected target changes, keep the earlier target with earlier data instead of recalculating a historical chart without marking the change.
Do not use a time-in-range percentage to change medicines or treatment on your own. The metric helps describe data within a specified range; it does not say what action is appropriate for a particular person. If the report is being used for clinical care, review the interval, coverage, and related measures with the clinician who understands the care plan.
Frequently asked questions
What does time in range mean?
It is the percentage of sensor readings or time within a specified glucose interval during a defined reporting period. The range, units, dates, and data coverage are part of the result.
Is one target range right for every adult?
No. Clinical targets are designed for defined groups of people with diabetes and may be individualized. A custom wellness range is not automatically a clinical target.
Why should I check sensor coverage?
Because the percentage reflects the data the sensor captured. Missing readings can make a period less representative, so keep active sensor time and data gaps beside the summary.
*This article is for informational purposes only and is not a substitute for professional medical advice, diagnosis or treatment.*
Sources:
American Diabetes Association·Diabetes Care·National Institute of Diabetes and Digestive and Kidney Diseases·Centers for Disease Control and Prevention·Diabetes Care·Diabetes Spectrum : A Publication of the American Diabetes Association
Related articles
Glucose sensor timing can lag behind changes in blood
Continuous glucose monitors sample interstitial fluid and estimate blood glucose from that signal. During rapid changes, the sensor reading may reflect a later point in the curve, so keep both measurement times and the device context visible.

Peak flow and spirometry report different breathing measures
Peak flow records the highest expiratory flow from a forceful breath out. Spirometry measures airflow and exhaled volume over time, so the test name, units, effort quality, and report comments should stay with each result.
A resting metabolic rate test depends on the test protocol
A resting metabolic rate test estimates energy use from gas exchange under defined conditions. The preparation, equipment, analysis method, and report details all affect how the value should be interpreted.

Bone density T-scores and Z-scores use different references
A T-score compares bone density with a young-adult reference, while a Z-score uses a more closely age-matched reference. Keep the score type, skeletal site, and report interpretation together because the two numbers are not interchangeable.

Waist measurements need a consistent anatomical landmark
Waist circumference can differ when the tape crosses different anatomical sites or follows a different plane. Keep the landmark, posture, breathing phase, and tape position with each date so a trend uses a consistent protocol.

Lean tissue on a body scan includes more than muscle
A body-composition scan reports method-dependent compartments such as lean soft tissue, not a direct count of skeletal muscle. Keep the exact scan label, body region, method, date, and testing context with the result before comparing it over time.

Urine albumin concentration needs its creatinine context
A spot urine albumin concentration changes with how diluted the sample is. The albumin-to-creatinine ratio adds context, while the full report and clinical question still guide interpretation.

A hemolyzed blood sample can complicate a potassium result
Cell damage during collection or handling can affect a measured potassium value. Keep the sample-quality comment with the report and have the result reviewed in its clinical context.

Biotin supplements belong in the record before a blood test
Biotin in supplements can affect selected laboratory assays, and the effect depends on the method used. A clear product, amount, and timing record helps the testing team decide whether an assay-specific review is needed.

A post-vaccine HRV change is not a personal immunity test
A wearable HRV change after vaccination can describe a physiological signal, but it cannot measure antibodies or personal protection. Learn why study associations, symptoms, and immune status answer different questions.